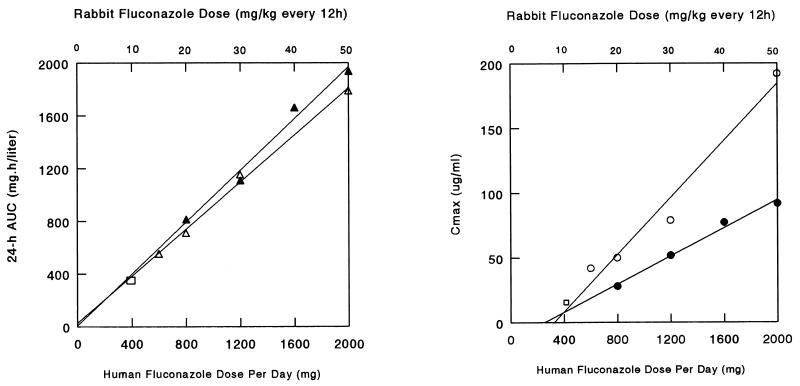
FIG. 2.
Relationship between AUC (left) (triangles) and Cmax (right) (circles) for fluconazole in the serum of rabbits (open symbols) receiving 15, 20, 30, and 50 mg/kg every 12 h and patients (closed symbols) receiving total daily dosages of fluconazole of 800, 1,200, 1,600, and 2,000 mg. Data for separate group of patients who received 400 mg/day are also shown (5) (squares).

