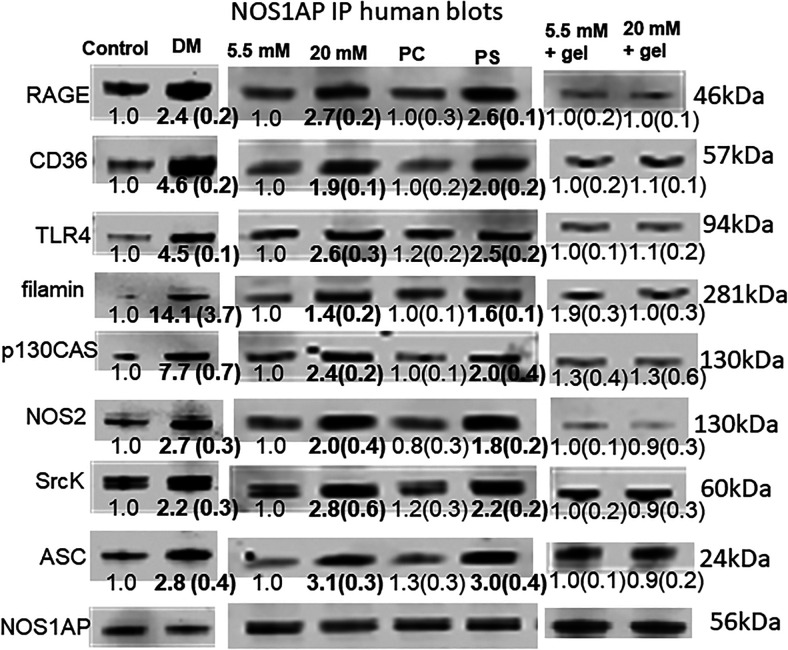
FIGURE 3.
Immunoprecipitation of human neutrophils using anti-NOS1AP Abs.
Images are representative blots, and numbers beneath images are mean band densities and SD normalized to NOS1AP loading and to the control value on individual blots (n = 4); bold numbers are significantly different from control, p < 0.05, ANOVA. The first two columns indicate cells obtained from control subjects or those with DM+DFU (labeled DM); the next two columns are control cells incubated for 2 h with 5.5 or 20 mM glucose, 10,000 PC- or PS-expressing beads; and the last two columns show blots from cells incubated with 5.5 or 20 mM glucose plus human recombinant gelsolin.

