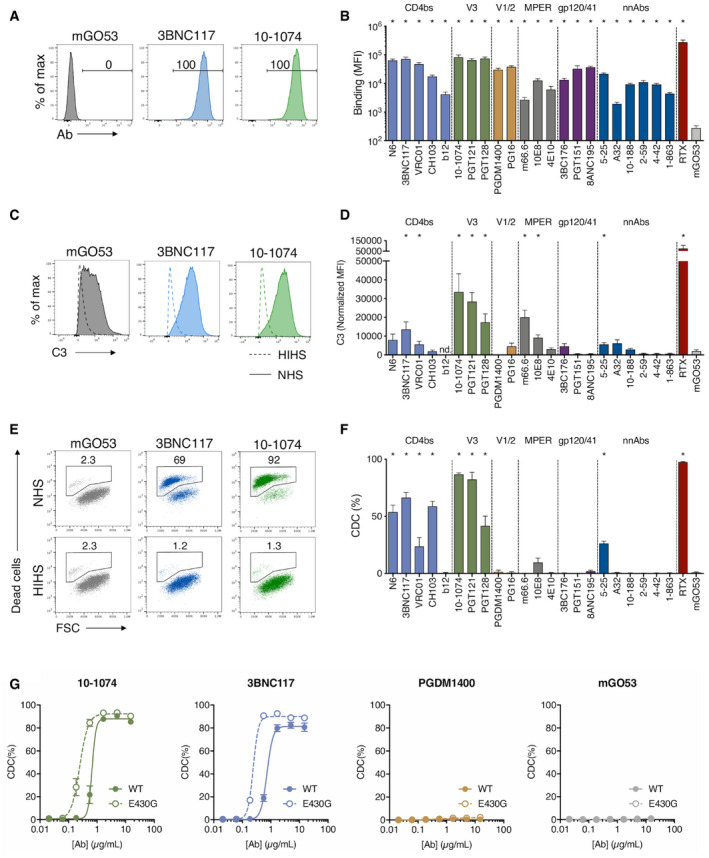
Raji cells stably expressing HIV‐1 YU‐2 Env (Raji‐Env) were stained with bNAbs (10‐1074 or 3BNC117) or isotype control (mGO53) and analyzed by flow cytometry. The numbers indicate the % of positive cells. One representative experiment is shown.
Binding of the 24 indicated antibodies to the surface of Raji‐Env cells. Results are expressed as the median fluorescence intensity (MFI) of staining. n = 6 independent experiments.
Raji‐Env cells were incubated with indicated antibodies and either normal (NHS) or heat‐inactivated (HIHS) human serum. After 1 h, surface levels of C3 were analyzed by flow cytometry. One representative experiment is shown.
C3 deposition by the 24 indicated antibodies. For each antibody, a normalized MFI is calculated by subtracting the MFI of the “no antibody” condition. (nd. not done). n = 3 donors of serum.
Raji‐Env cells were incubated with indicated antibodies and either normal (NHS) or heat‐inactivated (HIHS) human serum. After 24 h, cell death was determined by flow cytometry. The numbers indicate the percentage of dead cells. One representative experiment is shown.
CDC induction by the 24 indicated antibodies. The % of CDC was calculated as the relative percentage of dead cells compared to the “no antibody” condition. n = 3 donors of serum.
Raji‐Env cells were incubated for 24 h with NHS and indicated concentrations of WT or E430G mutant bNAbs (10‐1074, 3BNC117, or PGDM1400) or isotype control (mGO53). Cell death was measured by flow cytometry, and the % of CDC was calculated as the relative % of dead cells compared to the “no antibody” condition. n = 3 donors of serum.
Data information: Error bars indicate SEM. Significance was determined by comparing each antibody to mGO53. Only significant comparisons are depicted; *
< 0.05, Mann–Whitney test.