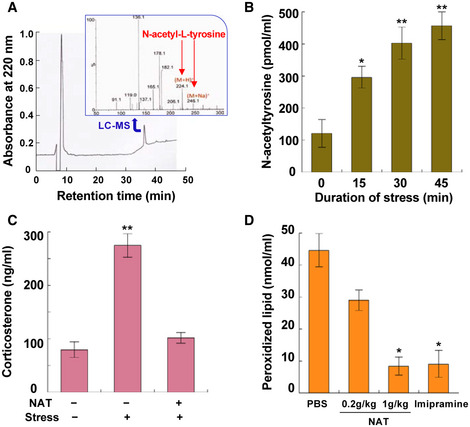
Figure 2. Analyses of the NAT‐induced hormesis response in mammals.

- HPLC chromatogram and LC‐MS spectrogram of N‐acetyltyrosine purified from pooled human serum (#12181201; Cosmo Bio Co., Japan). The peak fraction purified by HPLC was confirmed to be N‐acetyltyrosine by LC‐MS (inserted spectrogram).
- NAT concentrations in the serum of mice (Slc:ddY, 18‐week‐old male) exposed to heat (40°C) and restraint stress (data are means ± SEM; n = 5). *P < 0.05, **P < 0.01 vs. zero time.
- Effects of NAT on corticosterone concentrations in the serum of mice (Slc:ddY, 9‐ to 10‐week‐old male) exposed to restraint stress for 60 min (data are means ± SEM; n = 6). **P < 0.01 vs. without stress. Test mice drank 1.5 mg/ml NAT solution for 24 h before exposure to stress.
- Effect of NAT on stress‐induced peroxidized lipid in the serum of mice (Slc:ddY, 9‐week‐old male) forced to swim for 60 min (data are means ± SEM; n = 10). *P < 0.05 vs. PBS.
