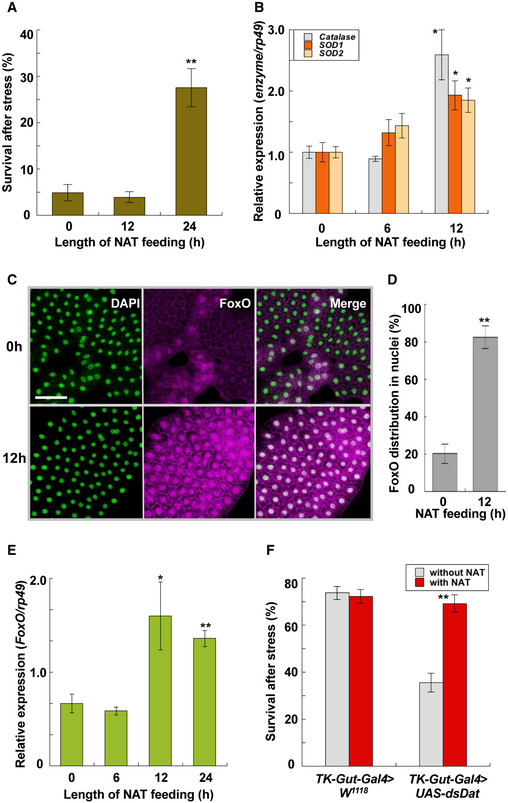
Survival of Drosophila melanogaster (W
1118
) larvae fed with 2 μmol NAT/g‐diet 2 days after heat stress at 38.5°C for 60 min (data are means ± SEM; n = 10). **P < 0.01 vs. zero time.
Effects of NAT feeding on expression of antioxidant enzymes, catalase, SOD1, and SOD2 (data are means ± SEM; n = 10). *P < 0.05 vs. zero time.
Representative images of nuclei (left) and FoxO (middle) in the fat body of Drosophila larvae before and after NAT feeding for 12 h. White signals in the merged image (right) show the overlap of both signals. Scale bar: 50 μm.
Relative whiteness intensities before and after NAT feeding (data are means ± SEM; n = 15). **P < 0.01 vs. zero time.
Effects of NAT feeding on FoxO expression in the fat body of Drosophila larvae (data are means ± SEM; n = 8). *P < 0.05, **P < 0.01 vs. zero time.
Effects of N‐acetyltransferase (Dat) knockdown in gut enteroendocrine cells (TK‐Gut‐Gal4 > UAS‐dsDat) on survival of Drosophila larvae (data are means ± SEM; n = 15). **P < 0.01 vs. without NAT.
Data information: Significant difference from each control value is indicated by Tukey's HSD.