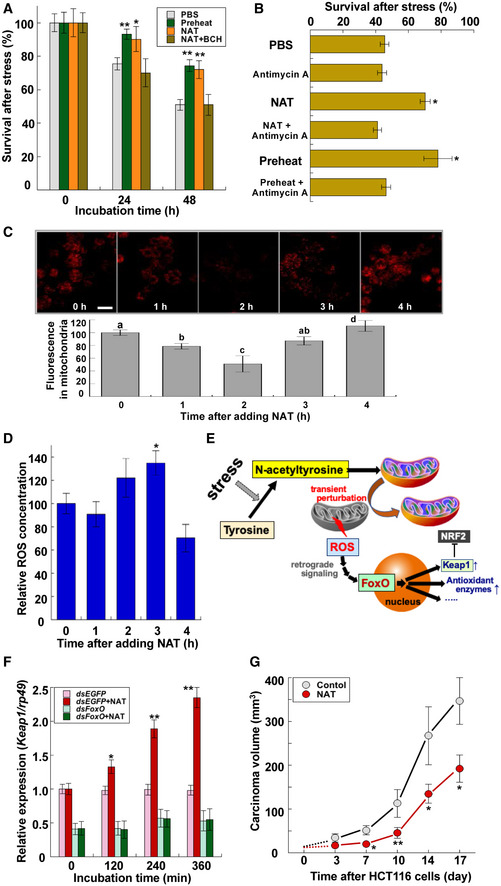
Survival of Drosophila S2 cells treated with preheating, 100 μM NAT, and 100 μM NAT with 10 mM 2‐aminobicyclo‐(2,2,1)‐heptane‐2‐carboxylic acid (BCH) after heat stress at 42°C for 60 min (data are means ± SEM; n = 10). After pretreatment with chemicals for 12 h, they were removed by changing the medium. *P < 0.05, **P < 0.01 vs. PBS.
Survival of Drosophila S2 cells pretreated with 100 μM NAT, 100 μM NAT with 30 μg/ml antimycin A, and preheating with or without 30 μg/ml antimycin A 48 h after heat stress at 42°C for 60 min (data are means ± SEM; n = 10). After pretreatment with chemicals for 12 h, they were removed by changing the medium. *P < 0.05 vs. PBS.
Effects of 100 μM NAT on MitoRed localization in mitochondria of S2 cells. Upper: representative images of time‐dependent changes in MitoRed localization in mitochondria after adding NAT. Scale bar: 20 μm. Lower: Relative intensities of MitoRed fluorescent signals in mitochondria were quantified by microplate reader. Different letters above bars represent significant differences [P < 0.05 (data are means ± SEM, n = 12)].
ROS concentrations in S2 cells after adding 100 μM NAT (data are means ± SEM; n = 12). *P < 0.05 vs. zero time.
Graphic depicting the participation of NAT in triggering mitohormesis in animal cells.
Effects of dsRNA targeting of FoxO on NAT‐dependent expression of Keap1 (data are means ± SEM; n = 12). *P < 0.05, **P < 0.01 vs. without NAT. Note that NAT feeding did not increase Keap1 expression in FoxO knockdown flies.
Effect of NAT on growth of HCT116 colon cancer cells in mice (BALB/cSlc‐nu/nu, 6‐week‐old female) (data are means ± SEM; n = 5). *P < 0.05, **P < 0.01 vs. without NAT. Test mice began to freely drink 5 mg/ml NAT solution for 7 days before transplantation of the tumor cells on day 0: The average amount of NAT consumed by each mouse was about 8.8 mg/day (0.4–0.5 g/kg weight/day). HCT116 cells (5.0 × 10⁶ cells) were transplanted into each test mouse using a 1‐ml syringe with a 27G needle.
Data information: Significant difference from each control value is indicated by Tukey's HSD.

