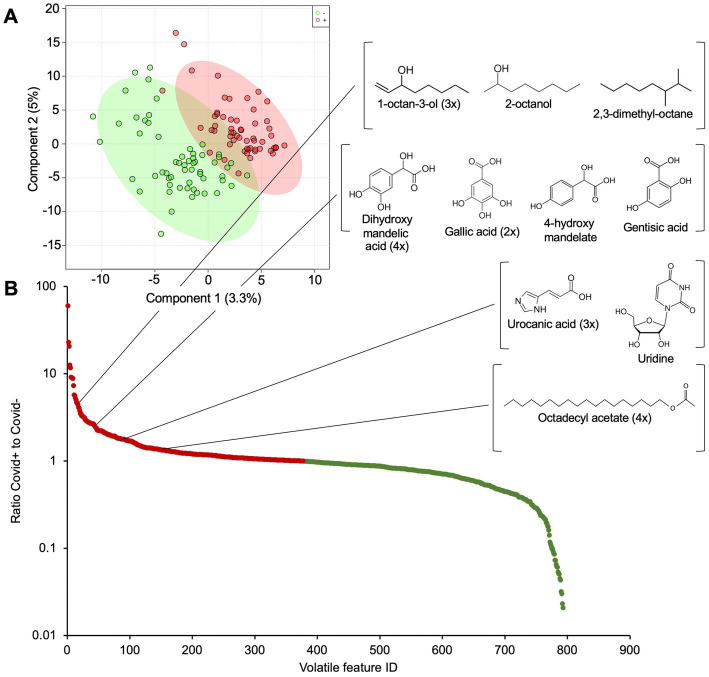
Figure 3.
Molecular exploration of differences between SARS-CoV-2-positive and SARS-CoV-2-negative sweat samples. (A) PLSDA plot indicates clear differences in metabolic background among the SARS-CoV-2-positive (red) and SARS-CoV-2-negative (green) sweat samples. (B) The plot shows the ratio of abundances of volatiles in SARS-CoV-2-positive versus SARS-CoV-2-negative sweat samples. Ratios higher and lower than one (i.e., volatiles that are enriched in SARS-CoV-2+ versus SARS-CoV-2- samples) are highlighted in red and green, respectively. Examples of important and recurrent annotated volatiles and their respective molecular related volatiles are depicted.

