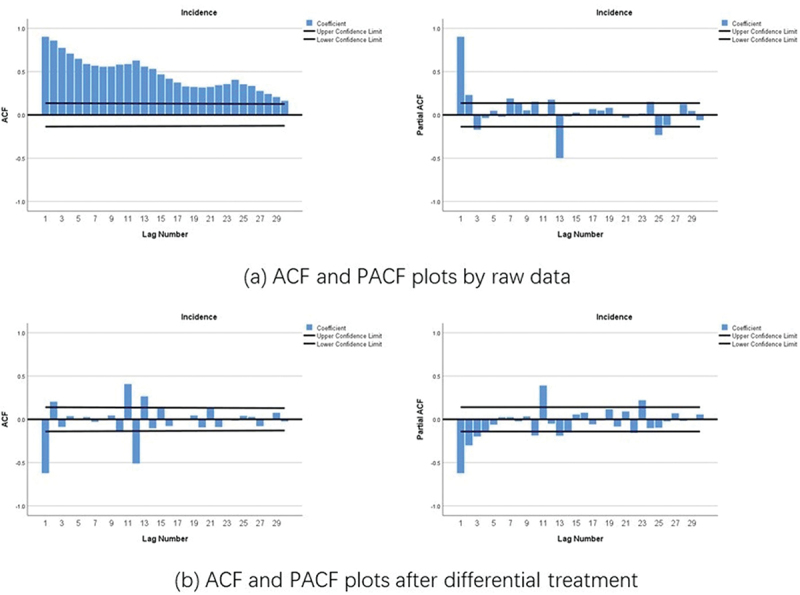
Figure 6.

Autocorrelation function (ACF) and partial autocorrelation (PACF) plots by raw data (a) and after differential treatment (b) for the number of incident cases from 2004 to 2018.

Autocorrelation function (ACF) and partial autocorrelation (PACF) plots by raw data (a) and after differential treatment (b) for the number of incident cases from 2004 to 2018.