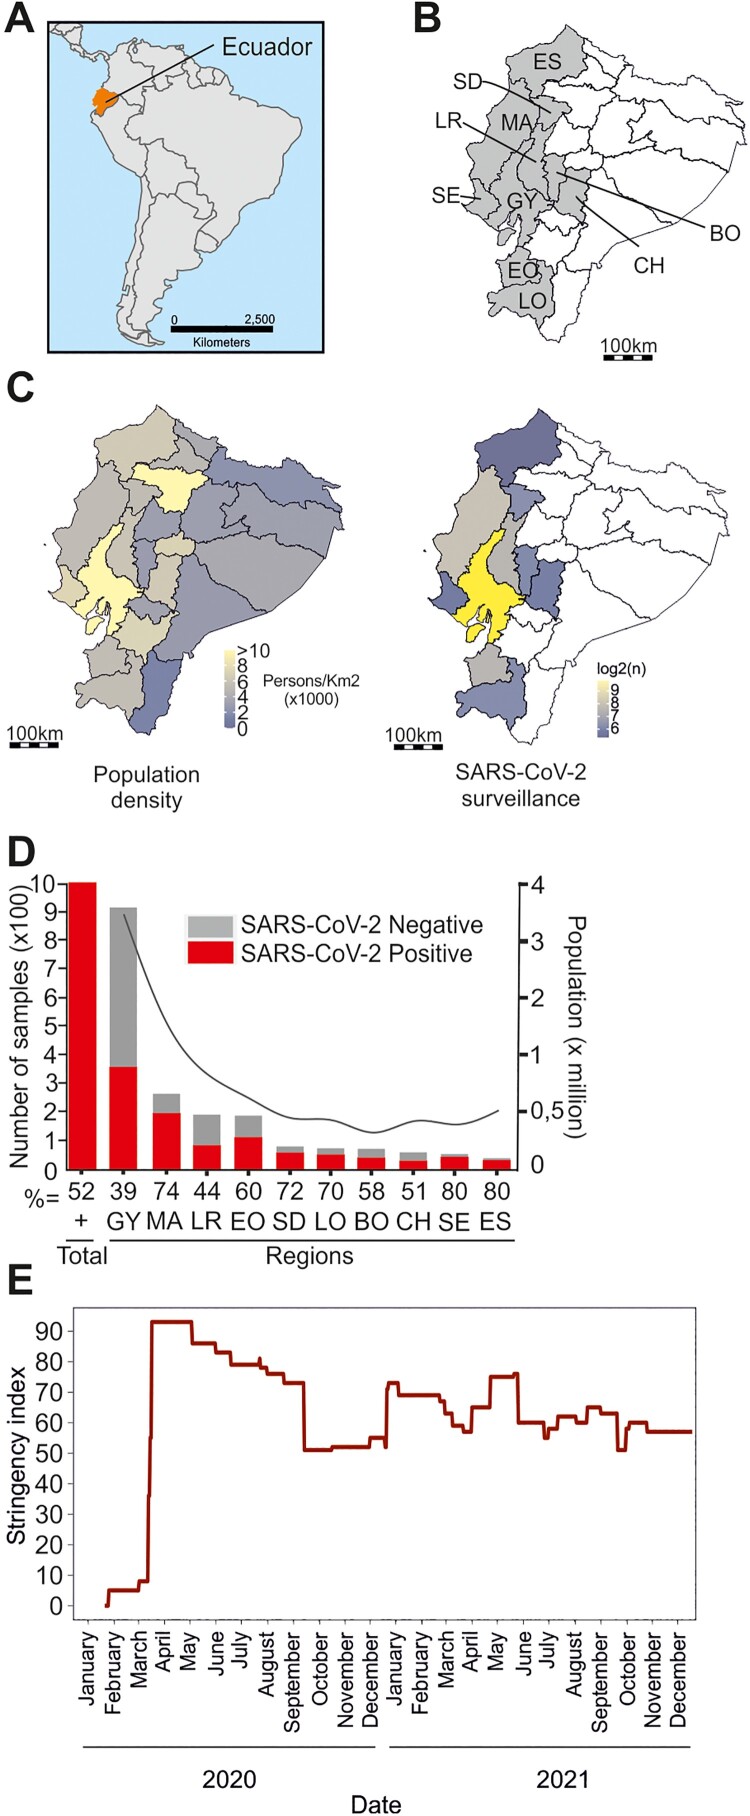
Figure 1.
Study setting. (A) Map of South America. Ecuador, orange. (B) Sampled Ecuadorian provinces (gray). ES = Esmeraldas, MA = Manta, SD = Santo Domingo, LR = Los Rios, SE = Santa Elena, GY = Guayas, BO = Bolivar, CH = Chimborazo, EO = El Oro, LO = Loja. (C) Population density, Ecuador (left). Spatial distribution of samples retrospectively tested for SARS-CoV-2 (right). (D) Sample number (left axis) and population in millions (right axis) of sampled provinces. Abbreviations as in (B). (E) OxCGRT stringency index; Ecuador.

