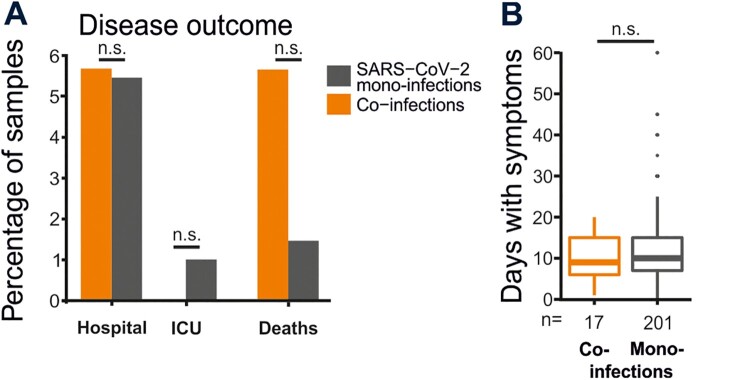
Figure 3.
COVID-19 course of SARS-CoV-2 co-infected versus mono-infected patients. (A) Percentage of co-infected and SARS-CoV-2 mono-infected patients that were hospitalized, admitted to the intensive care unit (ICU) and reported mortality. (B) Mean days with symptoms of co-infected and SARS-CoV-2 mono-infected patients (t-test with Bonferroni correction; p = 0.08). Dots represent outliers. N.S. not significant.

