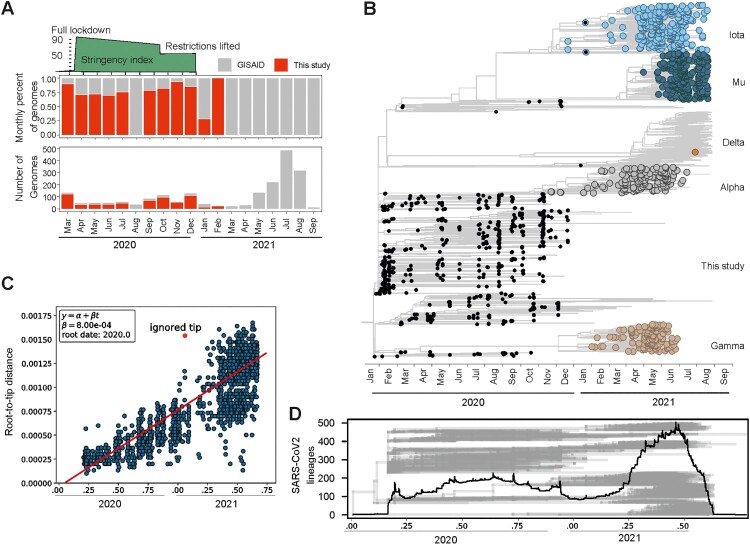
Figure 4.
Evolution of SARS-CoV-2 in Ecuador. (A) Monthly proportion and number of genomes analysed for this study. Red, genomes sequenced for this study. Gray, available genomes in GISAID. (B) Time-resolved maximum clade credibility phylogeny of SARS-CoV-2 in Ecuador. Black, sequences generated for this study. (C) Root-to-tip versus time regression analysis reconstructing the time of SARS-CoV-2 introduction to Ecuador. (D) Number of SARS-CoV-2 tips per time in the time-stamped phylogenetic tree (shown in gray).

