
 This work is licensed under a
 Figure 3.
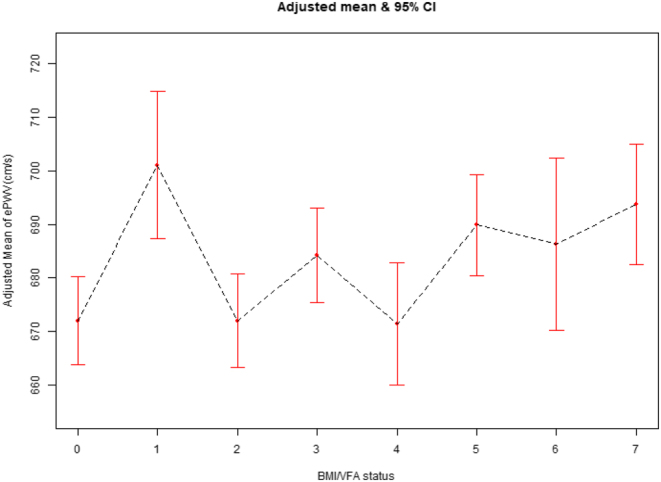
The relationship between BMI and visceral fat status with ePWV (cm/s) using the curve fitting of EmpowerStats, after adjusting for age, gender, race, education, marital status, family income ratio, diabetes mellitus, hypertension, hyperlipidemia, leisure time physical activity, smoking, drinking, and body surface area. Numbers 0–7 on the x-axis represent different BMI/VFA status: 0 = normal Weight and normal visceral fat, 1 = normal weight and visceral obesity, 2 = overweight and normal visceral fat, 3 = overweight and visceral obesity), 4 = obese grade 1 and normal visceral fat, 5 = obese grade 1 and visceral obesity, 6 = obese grade 2 and normal visceral fat, 7 = obese grade 2 and visceral obesity. BMI, body mass index; ePWV, estimated pulse wave velocity; VFA, visceral fat area.