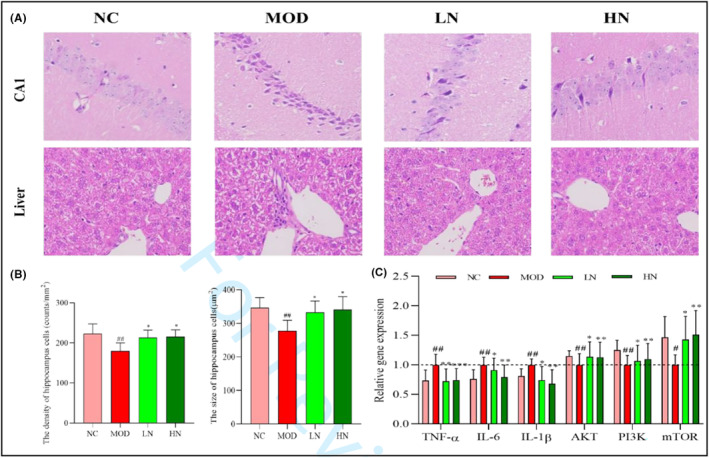
FIGURE 4.

Effect of NA on the cell morphology and gene expression in D‐galactose/AlCl3‐induced mice. (a) Effect of NA on cell morphology in the CA1 (HE staining, magnification 400×) and liver tissue (HE staining, magnification 400×). (b) Effect of NA on cell density and size of hippocampus. (c) Effect of NA on gene expression of PI3K, AKT, mTOR, TNF‐α, IL‐6, and IL‐1β in the brain. The data are presented as mean ± SD (n = 6). # p < .05 and ## p < .01 versus the NC group; *p < .05, **p < .01 and ***p < .001 versus the MOD group.
