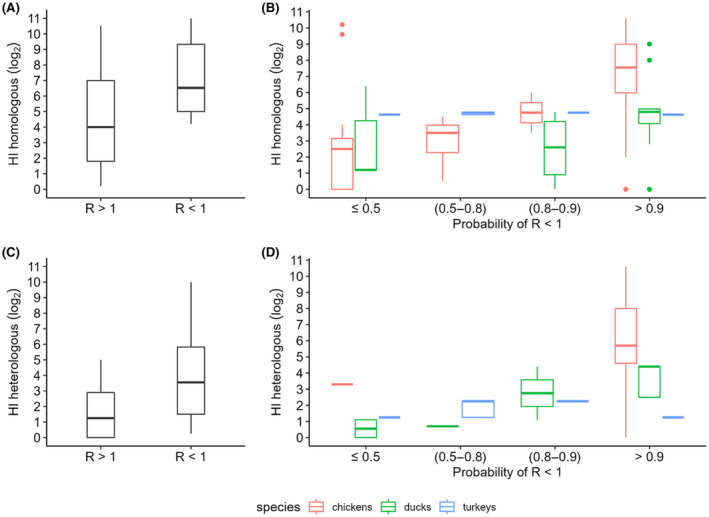
Figure 6.

Distribution of geometric mean haemagglutinin inhibition (HI) titres for vaccines which stopped sustained transmission between vaccinated chickens (R < 1) or did not (R > 1)
- Panels (A) and (C) show the distribution of homologous (A) or heterologous (C) HI titres reported in the reviewed transmission experiments. Panels (B) and (D) show the distribution of HI titres from the data obtained from the challenge experiments. Probability (R < 1) classes in these panels were derived using the model presented in Figure 5.
