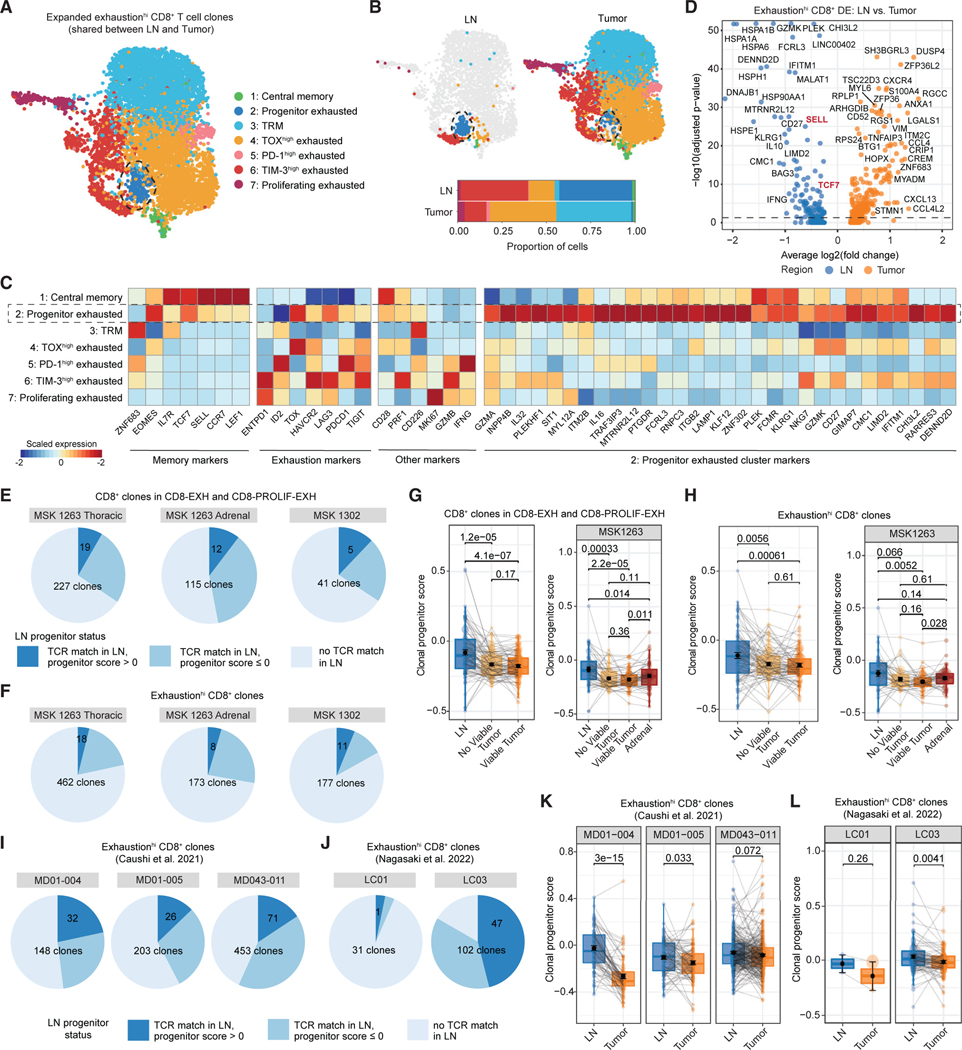
Figure 2. Intratumoral CD8+ T cells can be found in a TCF-1+ CD62L+ progenitor exhausted state in the regional LN.
(A) Uniform manifold approximation and projection (UMAP) of re-clustered cells from CD8+ T cell clones with high exhaustion scores (exhaustionhi) that were expanded (more than 2 cells) and found in both LN and tumor regions. Cells are colored according to phenotype cluster.
(B) UMAP of re-clustered cells from (A) split by region type: LN (left), tumor (right). Bar plots of phenotypic cluster distribution among cells from LN or tumor regions (bottom).
(C) Heat map showing expression of select memory, exhaustion, and progenitor exhausted cluster markers among the clusters from (A).
(D) Volcano plot of differentially expressed genes between clone-matched cells in the LN and tumor from exhaustionhi CD8+ T cell clones.
(E and F) Pie chart of CD8+ T cell clones in the CD8-EXH and CD8-PROLIF-EXH clusters (E) or exhaustionhi clones (F) in the tumor that could be matched to a clonotype in the LN (medium blue and dark blue, “TCR match in LN”). Dark blue slice indicates that the matched clone could be found with a progenitor score of greater than 0 in the LN.
(G) Paired box and whisker plots of average progenitor score per CD8+ T cell clone in the CD8-EXH and CD8-PROLIF-EXH clusters in thoracic regions of MSK 1263 and 1302 (left) or adrenal regions of MSK 1263 (right) that is matched among the LN, regions without viable tumor, and regions with viable tumor. Statistical testing by paired two-sided t test. Error bars represent standard error of the mean.
(H) Paired box and whisker plots of average progenitor score per exhaustionhi CD8+ T cell clone in thoracic regions of MSK 1263 and 1302 (left) or adrenal regions of MSK 1263 (right) that is matched among the LN, regions without viable tumor, and regions with viable tumor. Statistical testing by paired two-sided t test. Error bars represent standard error of the mean.
(I and J) Pie chart of exhaustionhi CD8+ T cell clones in two external datasets that could be matched to a clonotype in the LN (medium blue and dark blue, “TCR match in LN”). Dark blue slice indicates that the matched clone could be found with a progenitor score of greater than 0 in the LN.
(K and L) Paired box and whisker plot of average progenitor score per clone that is matched among the LN and tumor regions in five separate patients from two external datasets. Statistical testing by paired two-sided t test. Error bars represent standard error of the mean.
All box and whisker plots are defined as follows: center line, median; box, interquartile range; upper whisker limit, maximum without outliers; lower whisker limit; minimum without outliers; points, outliers.

