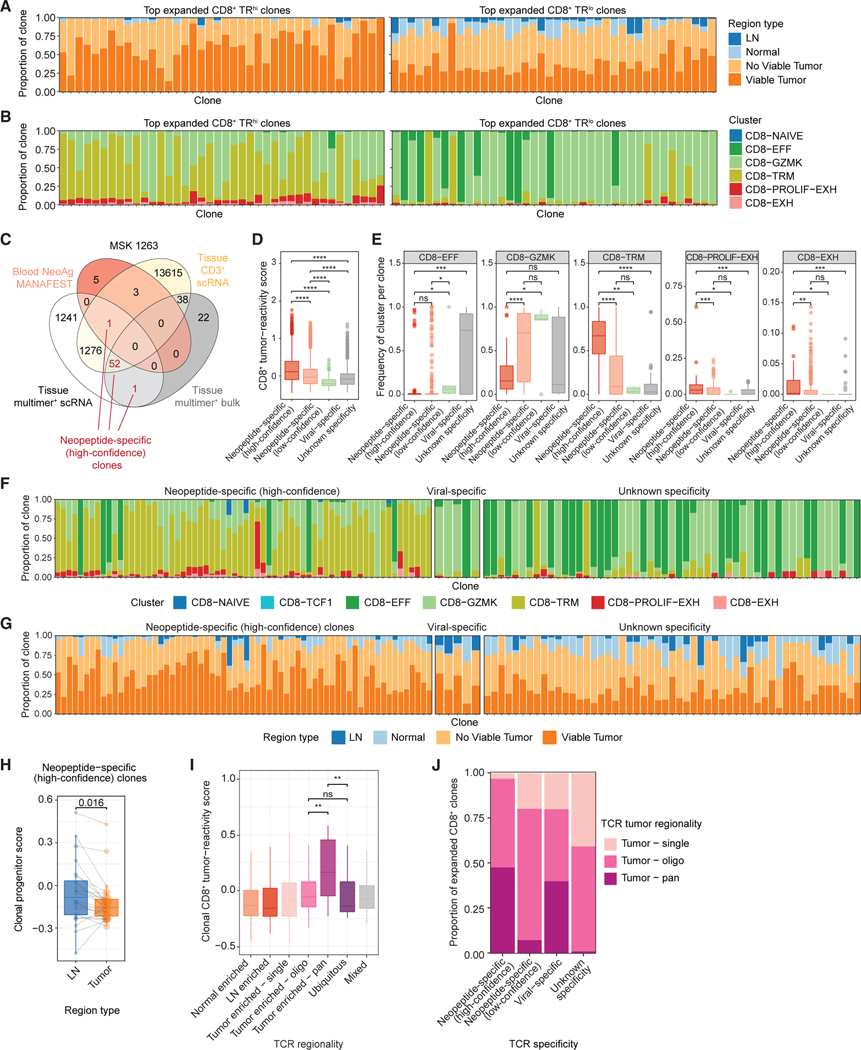
Figure 3. Phenotypic and regional enrichment of tumor-specific CD8+ T cell clones.
(A) Bar plots of the proportion of cells in the indicated region type among the top 40 most expanded TRhi (left) or TRlo (right) CD8+ clones.
(B) Bar plots of the proportion of cells in the indicated phenotype clusters among the top 40 most expanded TRhi (left) or TRlo (right) CD8+ clones.
(C) Venn diagram of overlap between TCRβ sequences from MSK 1263 identified by empirical tumor-specific methods and the tissue sorted CD3+ scRNA/TCR-seq dataset (yellow). Numbers indicate the number of TCRβ sequences in each intersection. Numbers colored in red represent TCRβ clones identified by at least two empirical methods (designated as high-confidence neopeptide-specific clones).
(D) Box and whisker plot of tumor-reactivity scores33 among CD8+ T cells with the indicated TCR specificity.
(E) Box and whisker plots of the proportion of cells in clones within each specificity belonging to the indicated CD8+ T cell clusters. Each point represents one TCR clone. Statistical testing by two-sided Wilcoxon-test (*p < 0.05, **p < 0.01, ***p < 0.001, ****p < 0.0001).
(F and G) Bar plots of the proportion of cells in the indicated phenotype cluster (F) or region type (G) among the top most expanded high-confidence neopeptide-specific clones (left), viral-specific clones (middle), or clones with unknown specificity (right).
(H) Paired box and whisker plot of average progenitor scores per high-confidence neopeptide-specific clone in MSK 1263 that is matched among the LN and tumor regions. Statistical testing by paired two-sided t test.
(I) Box and whisker plots of gene signature scores for CD8+ tumor-reactivity33 among clones with the indicated TCR regional pattern.
(J) Bar plots of the proportion of clones with each TCR specificity colored by TCR tumor regional pattern.
All box and whisker plots are defined as follows: center line, median; box, interquartile range; upper whisker limit, maximum without outliers; lower whisker limit; minimum without outliers; points, outliers.
See also Figures S8–S11 and Table S3.

