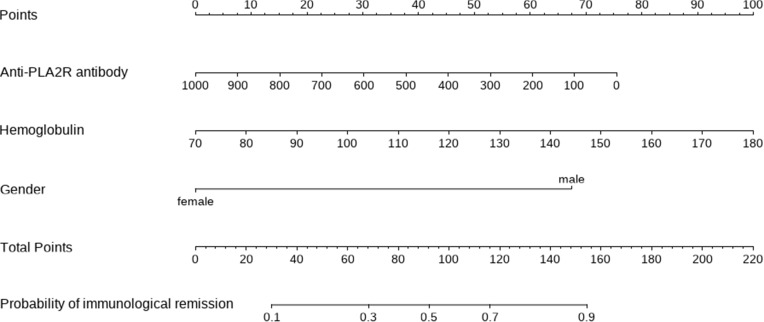
Figure 4.
A novel nomogram predicting for the probability of immunological remission. To use the nomogram, the specific point for each variable of the patient lies on each variable axis. Draw a vertical line upward to determine the point at which each variable accepts. The sum of these points is located on the Total Points axis, and draw a vertical line down to horizontal axis to determine the probability of immunological remission.

