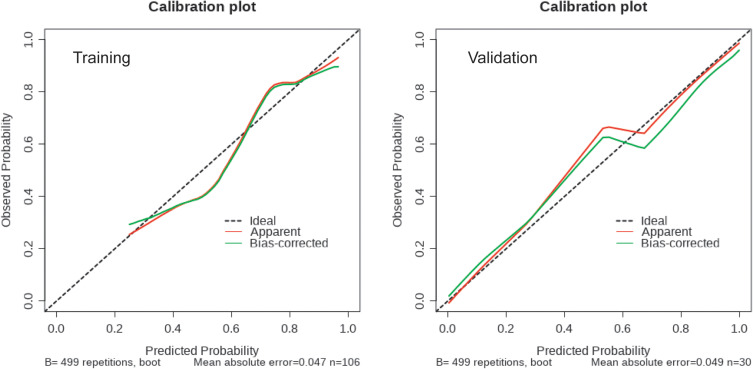
Figure 6.
Calibration curves of the nomogram in the training and validation datasets. The y-axis indicates the observed cumulative incidence for immunological remission, and the x-axis is the predicted probability of immunological remission based on the predictive model. The line adjacent to the ideal line represents the predictive accuracy.

