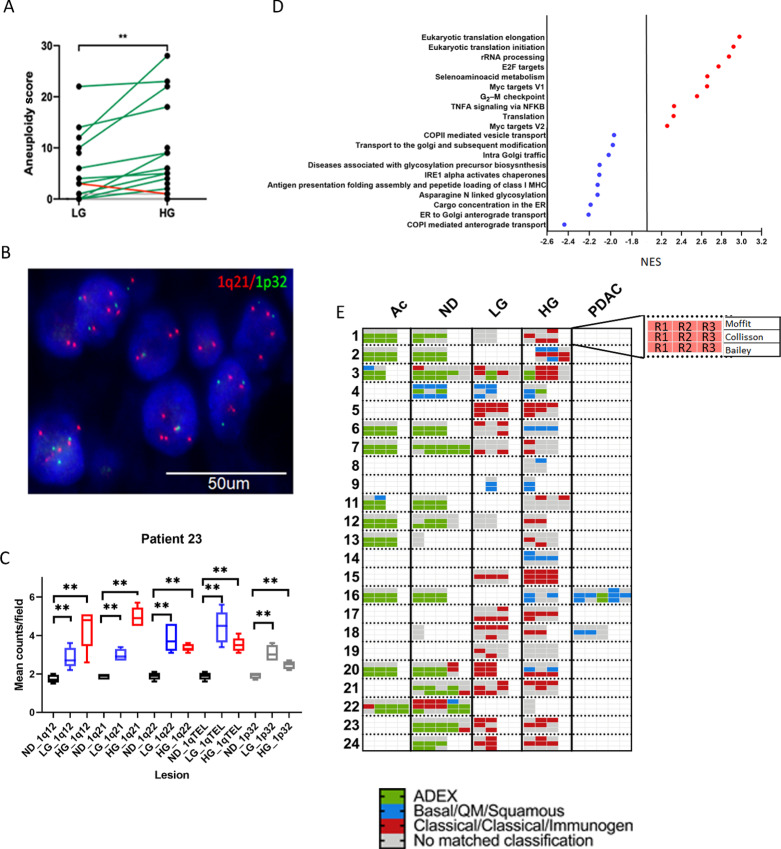
FIGURE 2.
Comparison of CNAs between LG and HG IPMNs. A, AS between LG and HG by paired analysis, green lines show an increase of AS upon progression while red lines a decrease. Validation (B) and quantification (C) of chromosome 1q amplification by FISH (ND: black colored bars, LG: blue colored bars, HG: red colored bars, gray reference 1p results). D, NES results for pathways upregulated and downregulated in HG versus LG (FDR < 0.01, P = 0), red and blue color highlights important pathway in PDAC. E, Expression of PDAC molecular subtypes in precancer cystic lesions per patient; 2–5 replicates (single colored box) were sequenced per region with each row representing classification by Moffit (top), Collisson (middle), and Bailey (bottom) and organized as it is shown in the inset.

