
FIGURE 3.
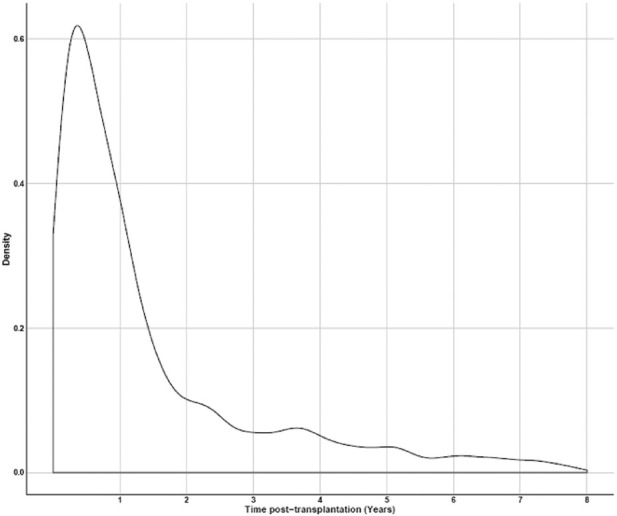
Density of time points where iBOX assessments were made (y-axis), compared with the time posttransplant (x-axis) out to 8 years, as shown in [7].
Official websites use .gov
A
.gov website belongs to an official
government organization in the United States.
Secure .gov websites use HTTPS
A lock (
) or https:// means you've safely
connected to the .gov website. Share sensitive
information only on official, secure websites.
Density of time points where iBOX assessments were made (y-axis), compared with the time posttransplant (x-axis) out to 8 years, as shown in [7].