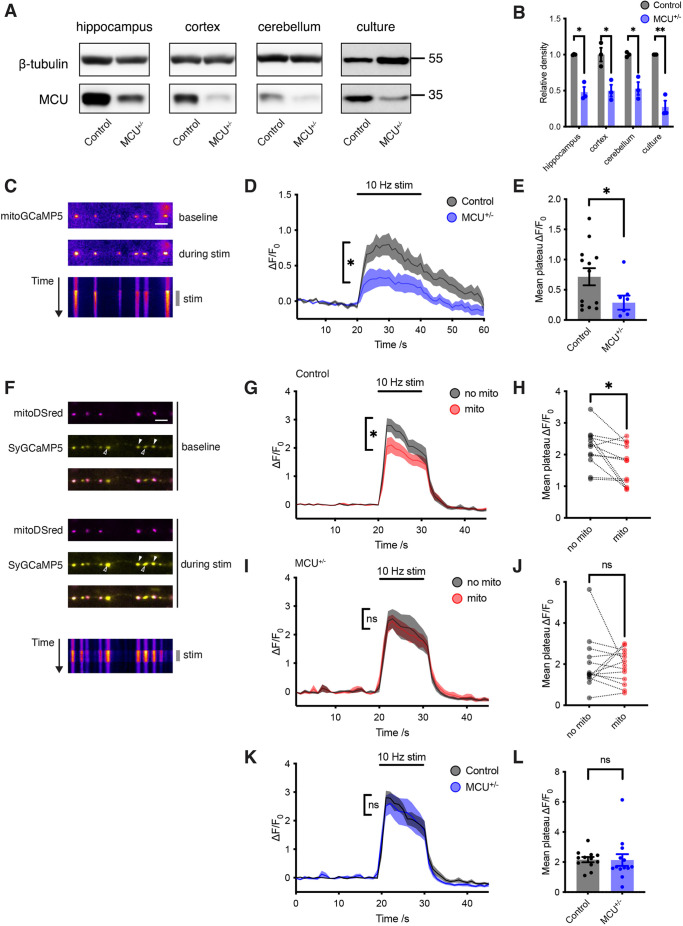
Fig. 1.
MCU heterozygosity blocks mitochondrial presynaptic Ca2+ clearance. (A) Western blot of MCU protein in lysate from 6-month-old mice (hippocampus, cortex and cerebellum), and E16 primary neuronal cultures. (B) Quantification of MCU protein level, normalised to β-tubulin (unpaired two-tailed t-tests, n=3). Hippocampus, *P=0.002; cortex, *P=0.016; cerebellum, *P=0.007; primary neuronal cultures, **P=0.001. (C) Live images of neurons transfected with mitoGCaMP5 before and during 10 Hz field stimulation (pseudocolour). Kymograph shows change in fluorescence over time (duration 60 s). Scale bar: 5 μm. (D) Average ΔF/F0 mitoGCaMP5 traces from control neurons (n=13, grey) and MCU+/− neurons (n=8, blue) showing average increase in mitochondrial fluorescence following stimulation for 20 s (t=20–40) at 10 Hz. (E) Average Ca2+ rise in mitochondria following stimulation (average of ΔF/F0 measurements taken for Δt=20–40 s from D). ΔF/F0 for mitochondria from control neurons=0.7±0.14 (n=13), and for mitochondria from MCU+/− neurons=0.3±0.12 (n=8) (unpaired two-tailed t-test, *P=0.049). (F) Live images of neurons transfected with mitoDSred (magenta) and SyGCaMP5 (yellow) before and during 10 Hz field stimulation. Kymograph shows change in fluorescence of SyGCaMP5 over time (duration 30 s). Filled arrowheads indicate terminals occupied by mitochondria, and empty arrowheads indicate unoccupied terminals. Scale bar: 5 μm. (G) Average ΔF/F0 SyGCaMP5 traces from control neurons (n=12) plotting average of terminals without mitochondria (grey) and with mitochondria (red). Stimulation occurred for 10 s (t=20–40) at 10 Hz. (H) Average Ca2+ response following stimulation of control neurons, comparing terminals with and without a mitochondrion (average of ΔF/F0 measurements taken for Δt=20–30 s from G). ΔF/F0=1.7±0.18 in terminals with mitochondria, and 2.2±0.17 in terminals without mitochondria (n=12) (paired two-tailed t-test, *P=0.016). (I) Average ΔF/F0 SyGCaMP5 traces from MCU+/− neurons (n=13) plotting average of terminals without mitochondria (grey) and with mitochondria (red). Stimulation occurred for 10 s (t=20–40) at 10 Hz. (J) Average Ca2+ response following stimulation of MCU+/− neurons, comparing terminals with and without mitochondria (average of ΔF/F0 measurements taken for Δt=20–30 s from G). ΔF/F0=1.9±0.18 in terminals with mitochondria, and 2.0±0.18 in terminals without mitochondria (n=13) (paired two-tailed t-test; ns, not significant, P=0.83). (K) Average ΔF/F0 SyGCaMP5 traces in terminals without mitochondria, in control (n=12, grey) and MCU+/− neurons (n=13, blue). Stimulation occurred for 10 s (t=20–40) at 10 Hz. (L) Average Ca2+ response following stimulation of control and MCU+/− neurons, in terminals without mitochondria (average of ΔF/F0 measurements taken for Δt=20–30 s from K). ΔF/F0=2.2±0.17 in terminals from control neurons (n=12), and 2.1±0.39 in terminals from MCU+/− neurons (n=13) (unpaired two-tailed t-test; ns, not significant, P=0.95). Experiments were performed in E16 mouse hippocampal neuronal cultures at 10–12 DIV. Error bars represent s.e.m.

