Fig. 2.
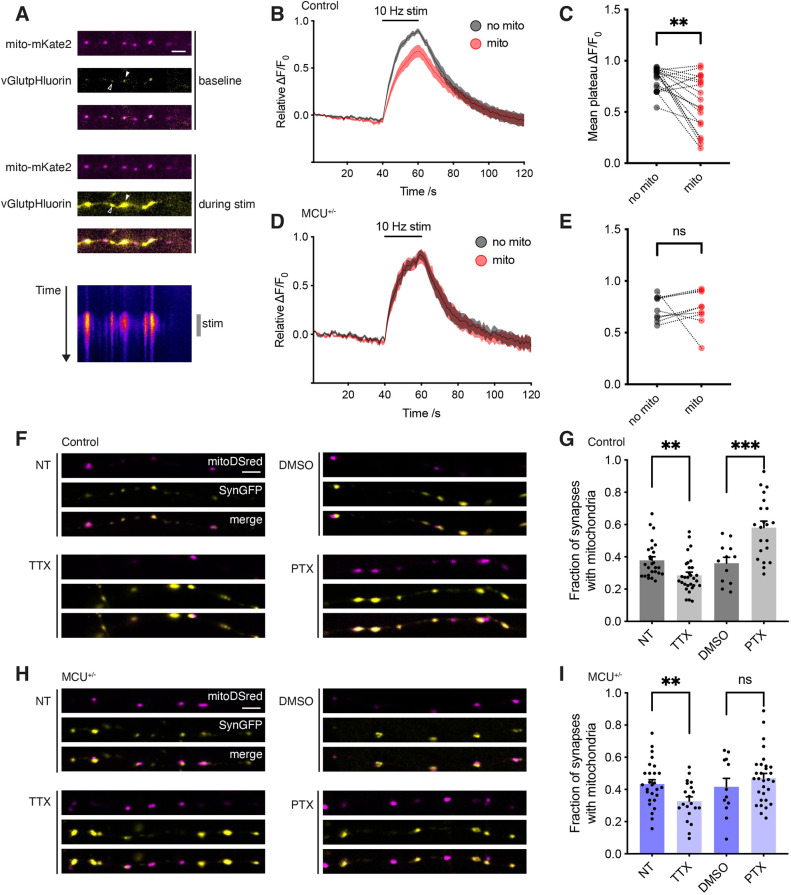
Functional impact of MCU heterozygosity on SV fusion and activity-dependent redistribution of mitochondria. (A) Live images of neurons transfected with mito–mKate2 (magenta) and vGlutpHluorin (yellow) before and during 10 Hz field stimulation. Kymograph shows change in fluorescence of vGlutpHluorin over time (duration 70 s). Filled arrowhead indicates synaptic terminal occupied by mitochondria, and empty arrowhead indicates an unoccupied terminal. (B) Average ΔF/F0 vGlutpHluorin traces from control neurons (n=19) plotting average of terminals without mitochondria (grey trace) and with mitochondria (red trace). Stimulation occurred for 20 s (t=40–60) at 10 Hz. (C) Average mean vGlutpHluorin response following stimulation of control neurons (average of ΔF/F0 measurements taken for Δt=50–60 s from B). ΔF/F0=0.59±0.06 in terminals with mitochondria, and 0.82±0.03 in terminals without mitochondria (n=19) (paired two-tailed t-test, **P=0.003). (D) Average ΔF/F0 vGlutpHluorin traces from MCU+/− neurons (n=9) plotting average of terminals without mitochondria (grey) and with mitochondria (red). Stimulation occurred for 20 s (t=40–60) at 10 Hz. (E) Average mean vGlutpHluorin response following stimulation of MCU+/− neurons (average of ΔF/F0 measurements taken for Δt=50–60 s from D). ΔF/F0=0.73±0.04 in terminals with mitochondria, and 0.73±0.06 in terminals without mitochondria (n=9) (paired two-tailed t-test; ns, not significant, P=0.99). (F) Confocal images of fixed control neurons transfected with mitoDSred (magenta) and synaptophysin–GFP (SynGFP; yellow). Neurons are either non-treated (NT), TTX-treated (1 μM, 48 h), DMSO-treated (1:2000, 48 h) or PTX-treated (100 μM, 48 h). Scale bar: 5 μm. g, Fraction of SynGFP clusters colocalising with mitochondria in control neurons. NT 0.38±0.02 (n=26), TTX 0.29±0.02 (n=30) (unpaired two-tailed t-test, **P=0.002). DMSO 0.36±0.04 (n=12), PTX 0.58±0.04 (n=21) (unpaired two-tailed t-test, ***P=0.001). (H) Confocal images of neuronal processes of fixed MCU+/− neurons transfected with mitoDSred (magenta) and SynGFP (yellow), with the same conditions as F. (I) Fraction of SynGFP clusters co-localising with mitochondria in MCU+/− neurons. NT 0.43±0.03 (n=27), TTX 0.33±0.03 (n=20) (unpaired two-tailed t-test; ns, not significant, P=0.35). DMSO 0.42±0.05 (n=12), PTX 0.47±0.03 (n=30) (unpaired two-tailed t-test, **P=0.008). Scale bars: 5 μm. Experiments were performed in E16 mouse hippocampal neuronal cultures at 10–12 DIV. Error bars represent s.e.m.

