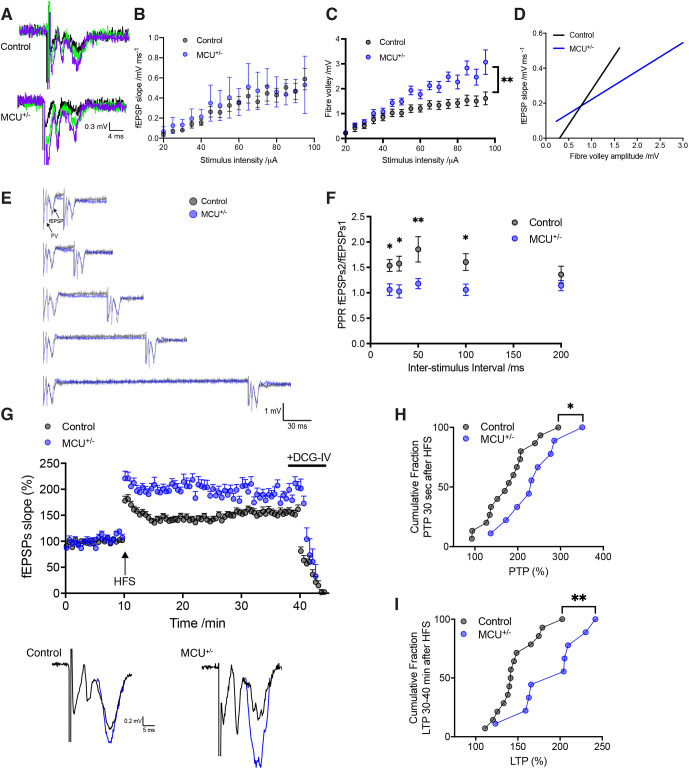
Fig. 3.
Larger fibre volley amplitude, loss of paired-pulse facilitation and increased PTP and LTP at the DG–CA3 MF synapse in MCU+/− hippocampal slices. (A) Representative traces of DG–CA3 MF fEPSPs are shown for control (top) and MCU+/− (bottom). The responses to a range of different stimulus intensities (30–80 µA) are superimposed. (B) Input–output relationship for control (black circles) and MCU+/− (blue circles) showing no difference in basal transmission (control n=13 slices; MCU+/− n=10 slices; two-way repeated measures ANOVA with Bonferonni correction, P=0.45). (C) Input–output relationship for fibre volleys showing higher fibre volley amplitudes in MCU+/− (control n=13 slices; MCU+/− n=10 slices; two-way repeated measures ANOVA with Bonferonni correction, **P=0.01). (D) MF fEPSP slope plotted against fibre volley amplitude for the same data (linear regression analysis, two-way repeated measures ANOVA with Bonferonni correction, ****P<0.0001). (E) Examples of PPR in control neurons (grey) and MCU+/− (blue) for a range of inter-stimulus intervals. (F) Mean PPR was reduced at inter-stimulus intervals of between 20 and 100 ms in the MCU+/− mouse (control n=12 slices; MCU+/− n=12 slices). Unpaired non-parametric Mann–Whitney test: 20 ms *P=0.0188, 30 ms *P=0.0112, 50 ms **P=0.0015, 100 ms *P=0.03, 200 ms P=0.4562. (G) Normalised fEPSP slope measurements for control (black circles) and MCU+/− (blue circles) before and after LTP induction (arrow). Representative traces of fEPSPs before (black) and after LTP induction (blue) from control (left) and MCU+/− (right) shown below. (H) Cumulative fraction of PTP showing a shift towards higher values in MCU+/− slices for the first 3 min after LTP induction (control 178.5±14.88%, MCU+/− 236.3±21.32%, n=9–15, unpaired two-tailed t-test, *P=0.0323). (I) Cumulative fraction of LTP 30–40 min after HFS train showing a shift towards higher LTP% in MCU+/− slices (control 147.6±6.65%, MCU+/− 189.2±12.83%, n=9–14, unpaired two-tailed t-test, **P=0.0048). Experiments were performed in acute hippocampal slices from mice at 1.5–2 months of age. Error bars represent s.e.m.

