Figure 3.
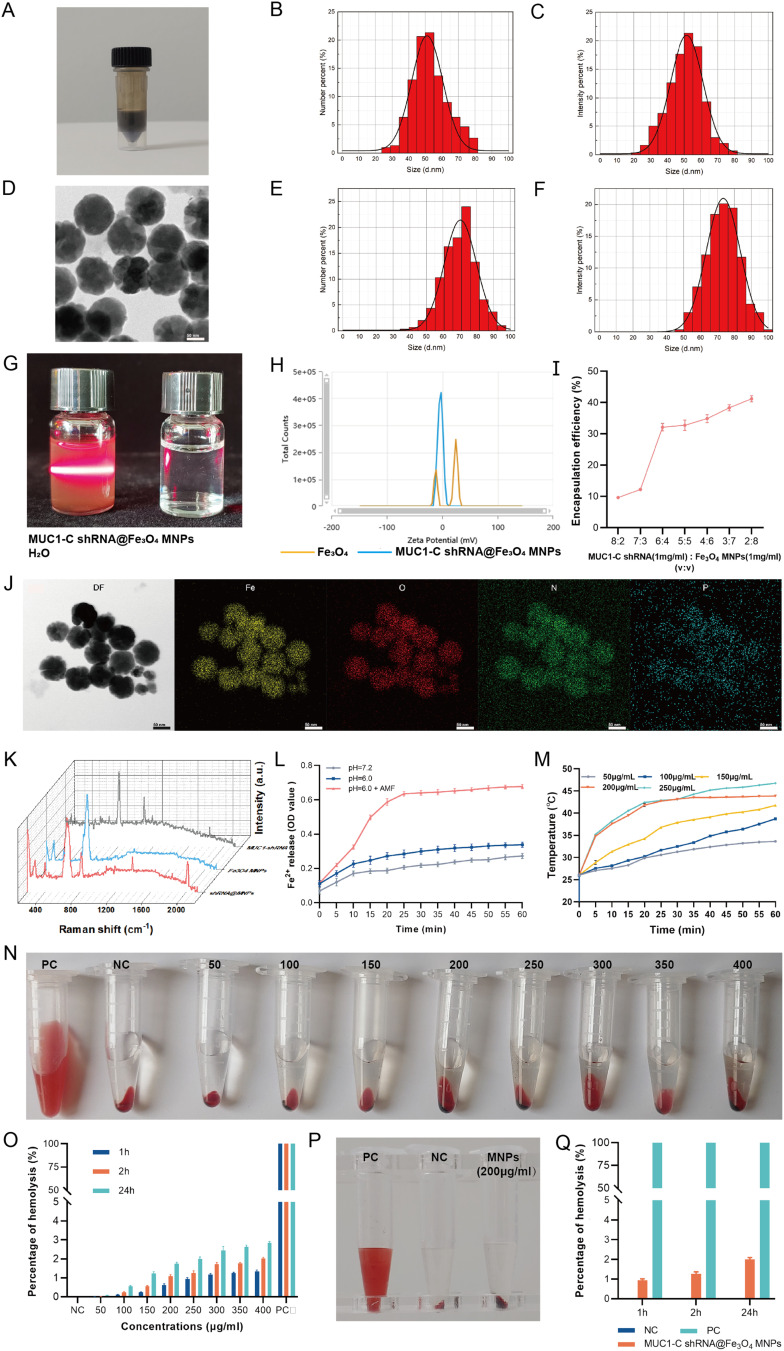
Characterization of MUC1-C shRNA@Fe3O4 MNPs. Appearance (A) and TEM image (D) of the prepared MUC1-C shRNA@Fe3O4 MNPs. DSL Size distribution of Fe3O4 MNPs (B and C) and MUC1-C shRNA@Fe3O4 MNPs (E and F). Tyndall effect of MUC1-C shRNA@Fe3O4 MNPs (G). Zeta potential of MUC1-C shRNA@Fe3O4 MNPs (H). Encapsulation efficiency at different shRNA/MNPs ratios (I). TEM elemental mapping analysis of MUC1-C shRNA@Fe3O4 MNPs (J). Raman spectrum of MUC1-C shRNA, Fe3O4 MNPs, and MUC1-C shRNA@Fe3O4 MNPs (K). Release profiles of Fe2+ from MUC1-C shRNA@Fe3O4 MNPs at different pH values with or without AMF (L). The heating curves of MUC1-C shRNA@Fe3O4 MNPs with different concentrations (50–250μg/mL) (M). Hemolysis test at different concentrations (MUC1-C shRNA@Fe3O4 MNPs) (n=3) (N and O). Hemolysis test (200μg/mL, n=3) (P and Q). Error bars represent means ± SD. TEM scale bar: 50nm.

