. 2023 Sep 19;23(20):4552–4564. doi: 10.1039/d3lc00512g

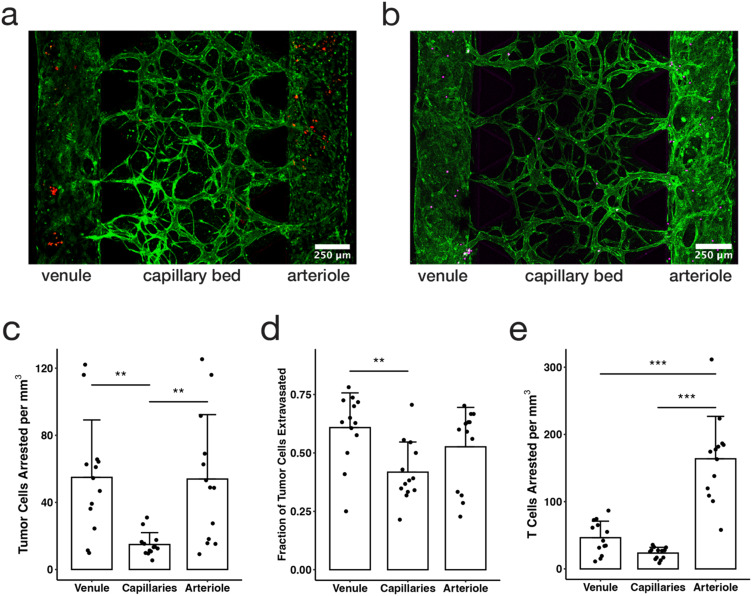
Fig. 4. The hierarchical tricompartmental model can be used to measure arrest and extravasation efficiency of different circulating cells. (a) Fixed confocal image of tricompartmental model 48 hours after tumor cell perfusion (green = ECs, red = MBA-MB-231 tumor cells). (b) Live confocal image taken directly after Jurkat T cell perfusion (green = HUVECs, magenta = Jurkat T cells. (c) Number of tumor cells arrested per mm3 of device volume in each of three compartments (data points indicate measurements from individual devices, bars indicate average, and error bars indicate standard deviation; n = 13; statistical significance determined by ANOVA and Tukey HSD tests: * p < 0.05, ** p < 0.01, *** p < 0.001). (d) Fraction of tumor cells that extravasated within each compartment over a period of 48 hours. (e) Number of T cells arrested per mm3 of device volume in each of three compartments.

Fig. 4