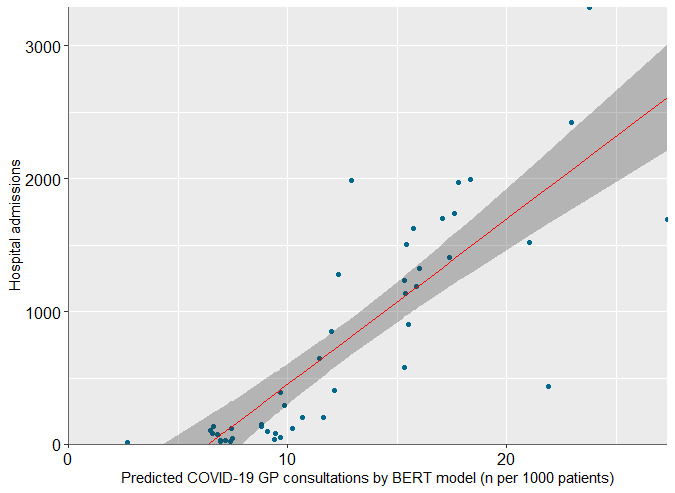
Figure 4.

Scatterplot showing the relationship between predicted COVID-19 consultations by developed bidirectional encoder representations from transformers model and hospital admissions related to COVID-19 in the Netherlands. This plot shows the linear regression line (red) and the 95% CI (gray-shaded area). Each dot represents a weekly observation. BERT: bidirectional encoder representations from transformers; GP: general practitioner.
