
Figure 1-2.
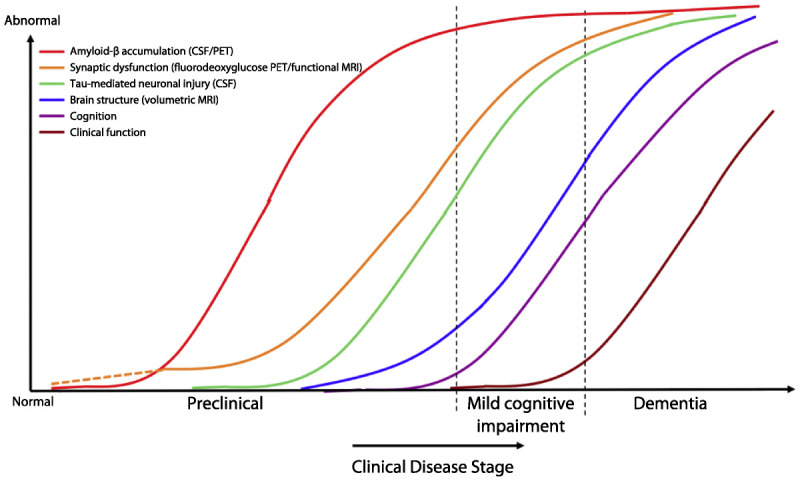
Hypothetical model of dynamic biomarkers of Alzheimer disease. Biomarkers: Amyloid-β (Aβ) as identified by CSF Aβ42 assay or positron emission tomography (PET) amyloid imaging (red); synaptic dysfunction evidenced by fluorodeoxyglucose PET or functional MRI (orange), with a dashed line to indicate that synaptic dysfunction may be detectable in carriers of the *E4 allele of the APOE gene prior to detectable amyloid-β deposition; neuronal injury evidenced by CSF tau or phosphorylated tau (green); volumetric MRI (blue). Biomarkers change from normal to maximally abnormal (y axis) as a function of disease stage (x axis). The temporal trajectories of two key clinical indicators used to stage the disease, cognition (purple) and clinical function (maroon), are also illustrated.
Adapted from Jack CR Jr, et al, Lancet Neurol.18 © 2010, with permission from Elsevier. www.sciencedirect.com/science/article/pii/S1474442209702996.
Reprinted from Sperling RA, et al, Alzheimers Dement.27 © 2011 The Alzheimer’s Association. All rights reserved. www.alzheimersanddementia.com/article/S1552-5260(11)00099-9/fulltext.