
Figure 7-2.
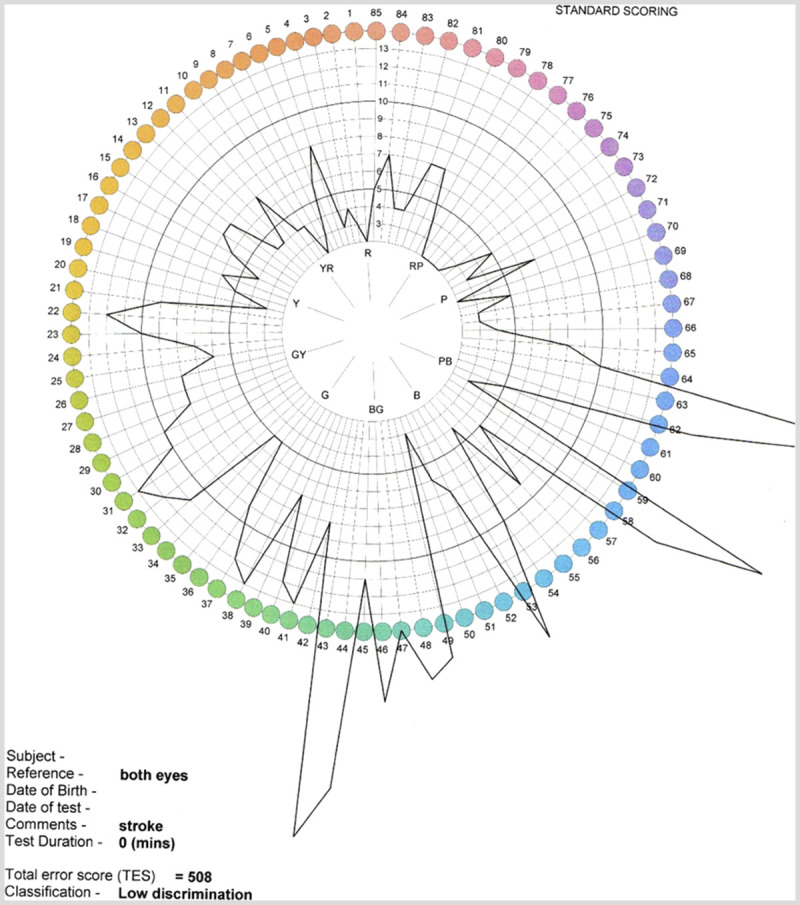
Farnsworth-Munsell color test results of the patient with cerebral dyschromatopsia in Case 7-1. The black lines indicate the magnitude of the patient’s error for color sorting at each hue location. The greater distance away from the center of the disc, the greater the error. The patient has difficulty with all hues, and particularly with green and blue. These findings are consistent with the patient’s own observations from daily life.