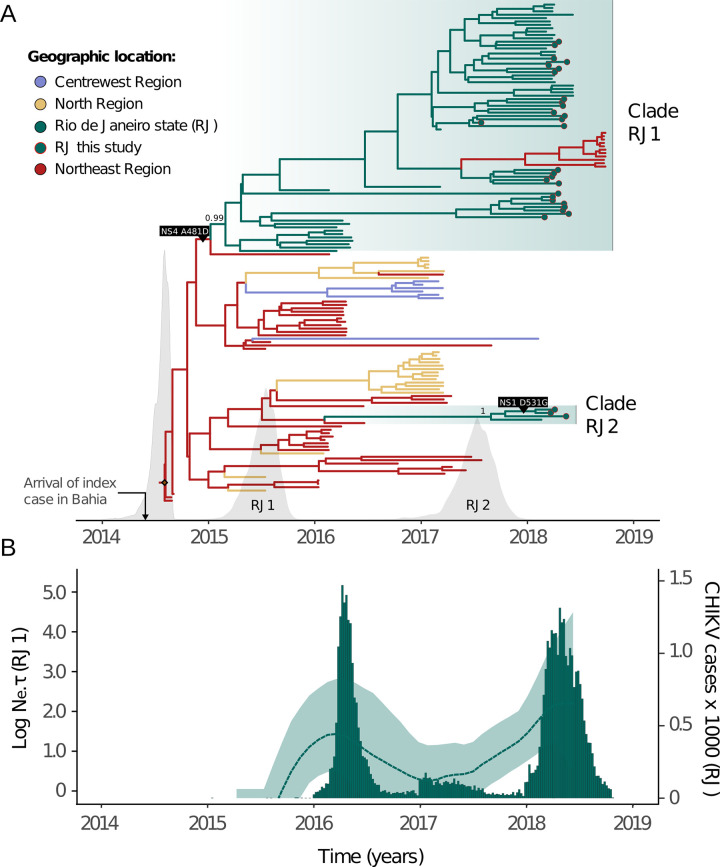
Fig 4. Bayesian time scaled phylogeographic reconstruction for the clade ECSA-Br.
(A) The molecular clock phylogeny annotated with discrete trait reconstructions. Colors indicate estimated ancestral locations (Centre-West region: purple, North region: yellow, Northeast region: red, Rio de Janeiro state: green). Tip shapes mark sequences generated in this study. The x-axis depicts the timescale, while the density plots indicate the posterior distributions estimated for the age of clades ECSA-American, RJ1 and RJ2. Posterior probabilities for both RJ clades are shown. Positively selected mutations detected with MEME and FEL models (NS1: D351G and NS4: A481D) are exhibited on the branches where they occurred according to the ancestral states reconstruction performed (TreeTime). The inset marks the date of arrival of the index case in the Northeast region. (B) Skygrid reconstruction plot for the clade RJ1. A separate analysis was performed with only RJ sequences from the clade RJ1, allowing the reconstruction of the dynamics of variation of viral effective population size in the state (left y-axis). The analysis reveals CHIKV genetic diversity varied over time, with periods of high diversity matching peaks observed in incidence data (right y-axis).

