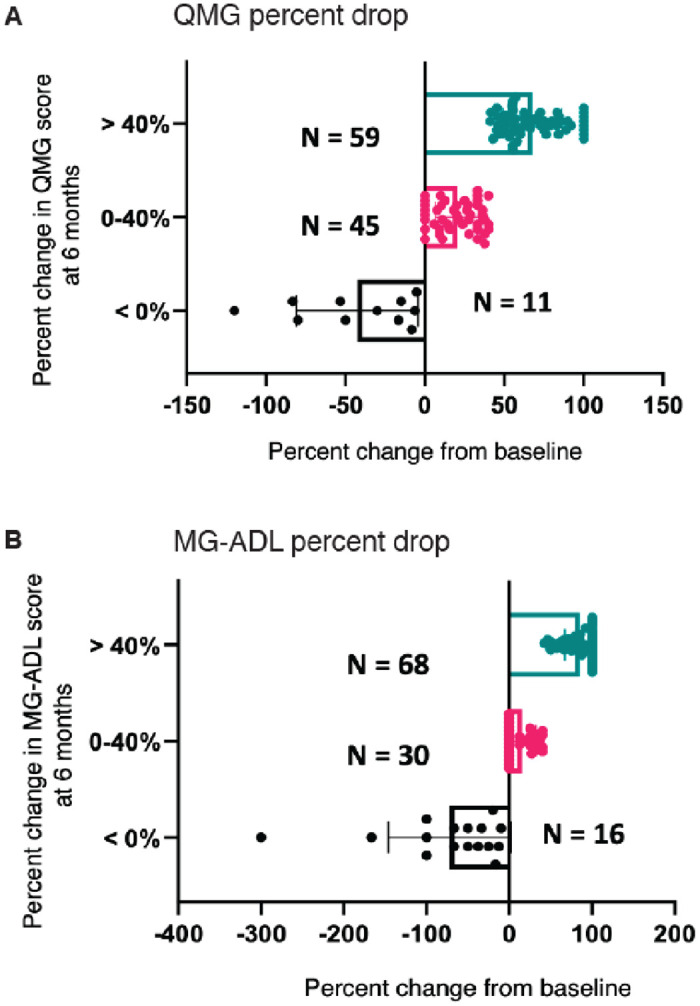
Fig 2. Percent drop of (A) QMG score and (B) MG-ADL score from baseline to 6 months post treatment.

Subjects are grouped according to percent change in score (> 40% (represented as teal dots), 0–40% (represented as pink dots), or < 0% (represented as black dots)). Subjects with score > 40% improvement in QMG and MG-ADL are defined as treatment responsive whereas those with < 0% (no improvement or worsening score) are defined as treatment non-responsive.
