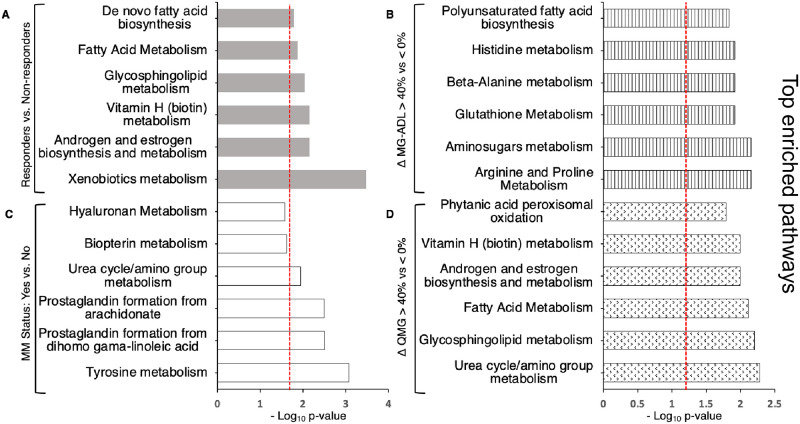
Fig 7. Metabolic pathway analysis for four outcome measure.
Top significantly enriched pathways (treatment responsive vs treatment non-responsive) in each outcome measure: (A) Responders (gray shaded bars), (B) change in (Δ) MG-ADL score (vertical stripped bars), (C) MMS (open bars), and (D) change in (Δ) QMG score (dotted pattern bars). Pathway enrichment was performed using mummichog (Fisher’s exact test). P-values are shown on x-axis and specific values are reported in S4 Table.

