
Figure 2. PLCG2 variants affect plaque pathology and microglial uptake of Aβ aggregates.
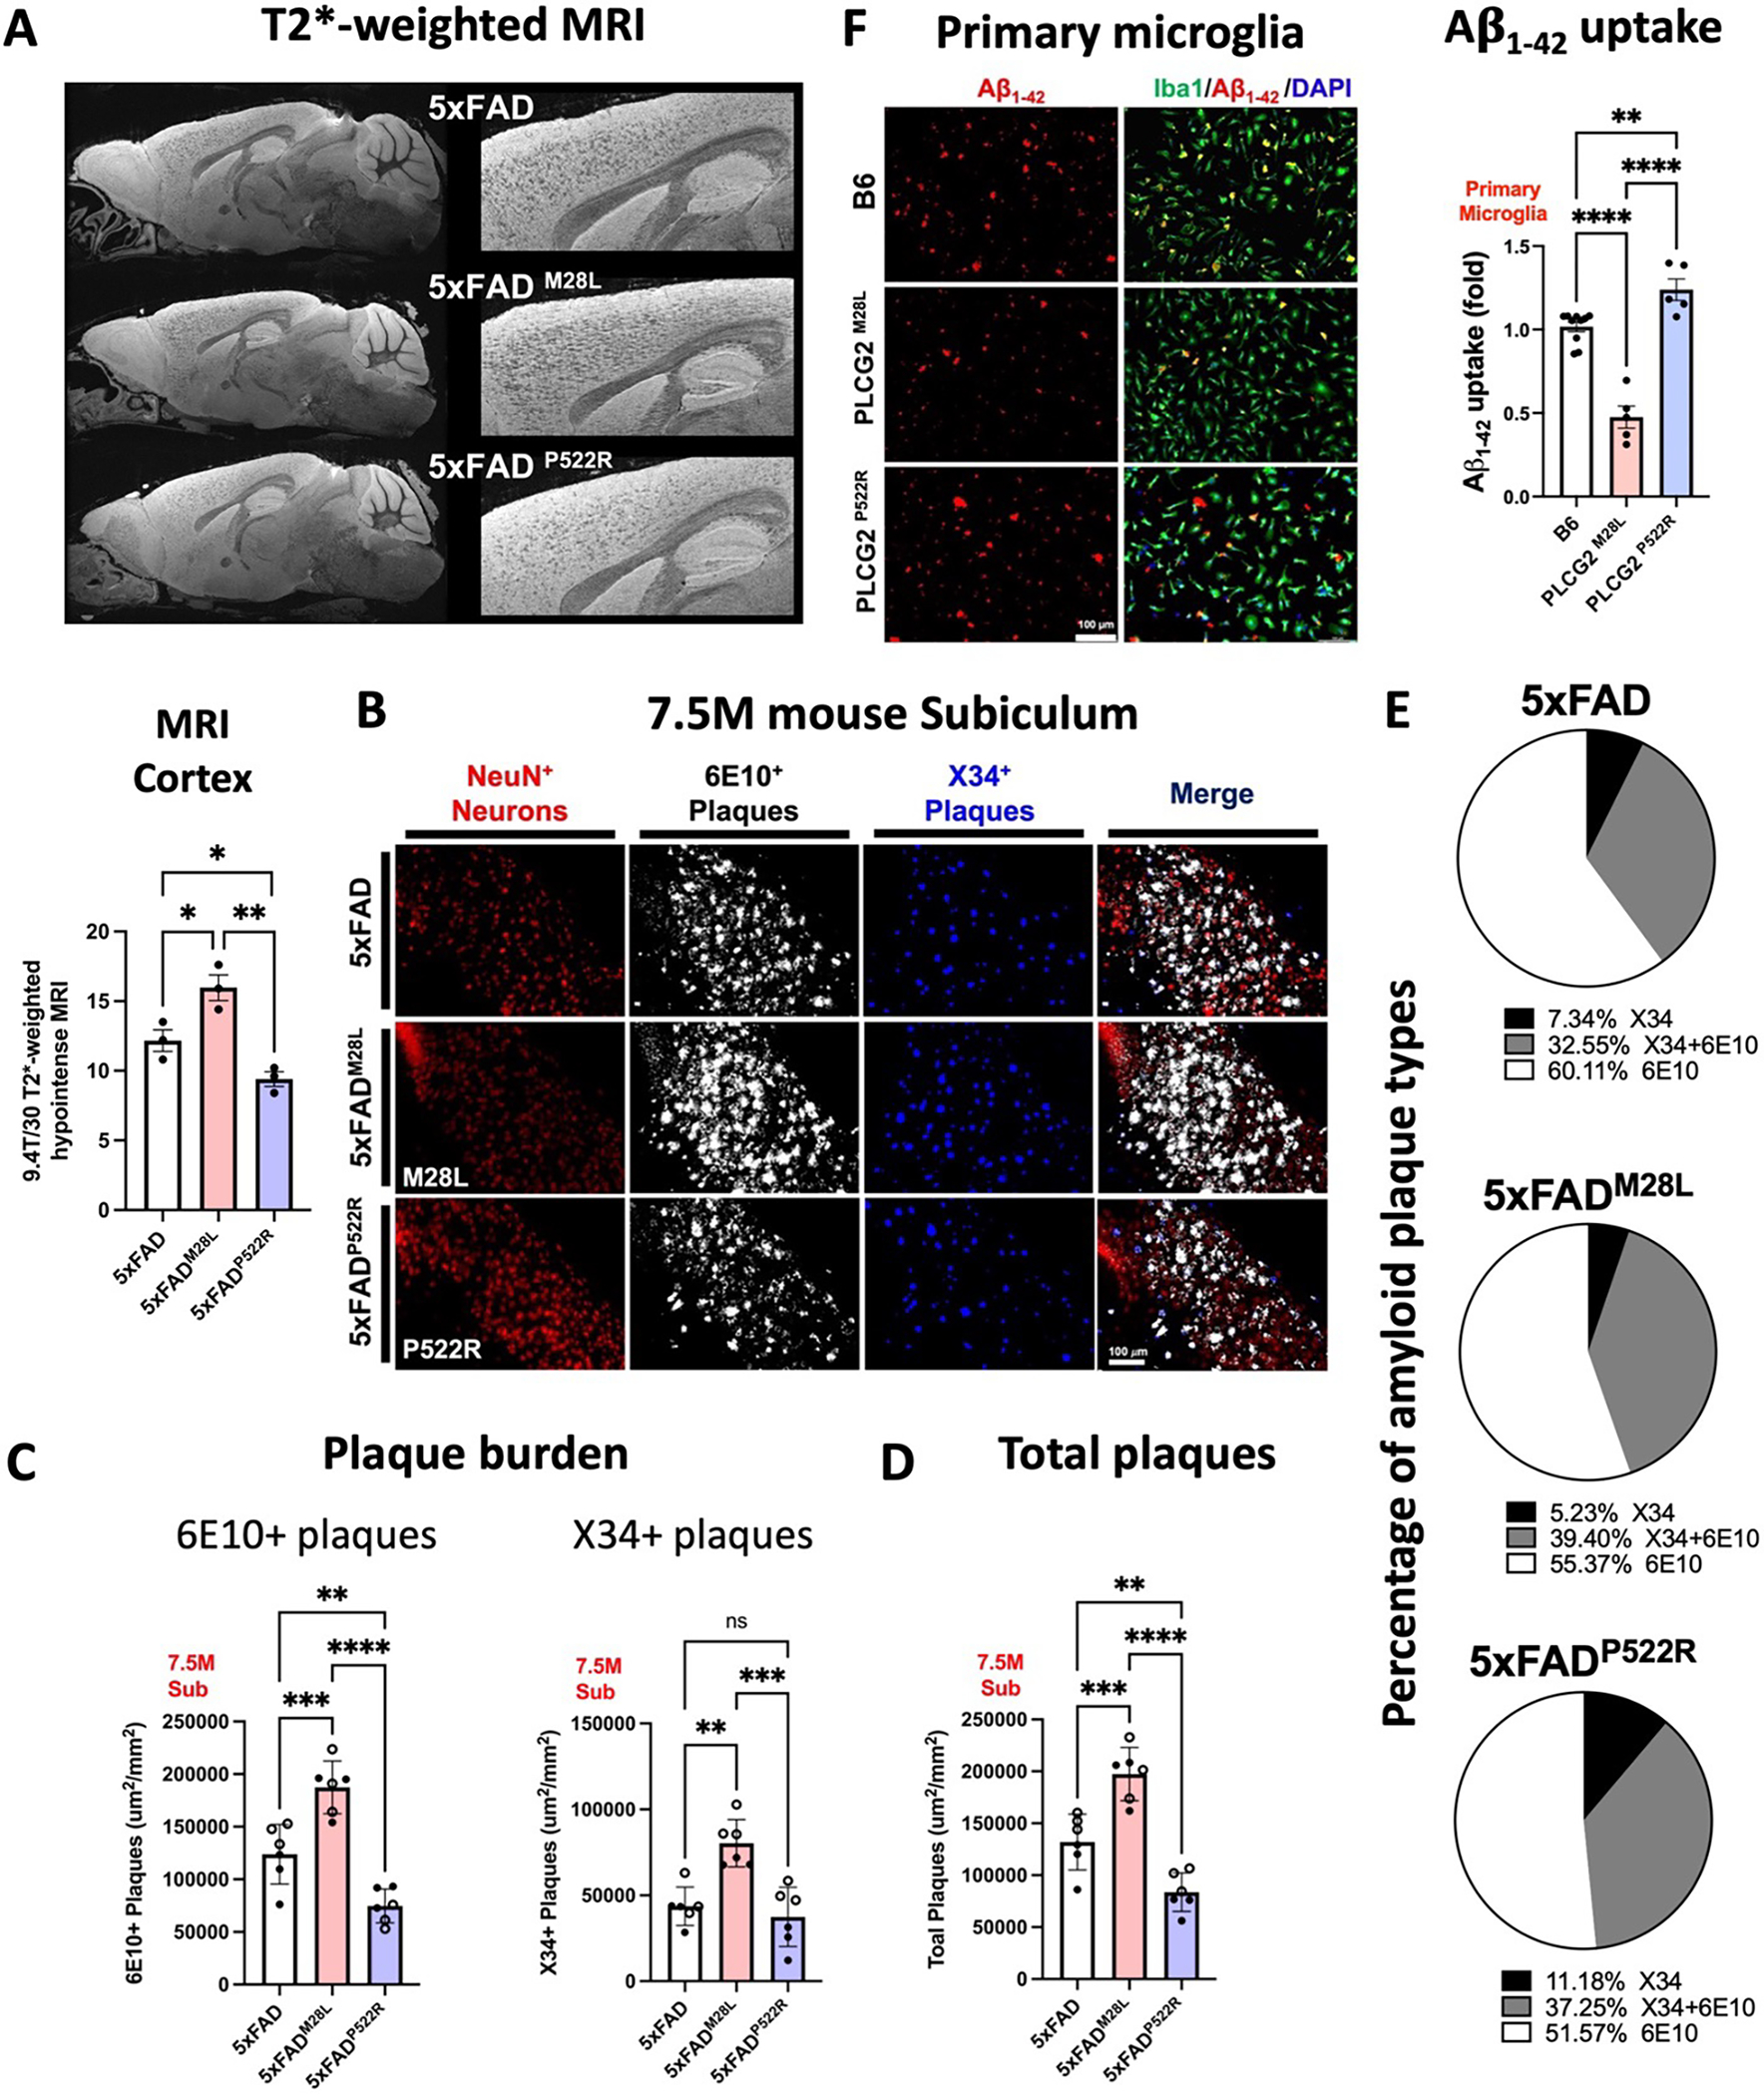
(A) Representative T2*-weighted images and quantitative hypointense signal results in the cortex of 7.5-month-old AD mice. (B) Representative images of amyloid plaques in the subiculum of 7.5-month-old AD mice (6 experiments). (C) Immunofluorescence analysis of diffuse 6E10 (white) and compact X34 (blue) positive plaque density in the subiculum. (D) Scatter plots show the quantification of the total plaque (6E10-positive and X34-positive) area in the subiculum. (E) Graphs denoting the percentage of plaques labeled with X34, 6E10, or their colocalized area. (F) Immunofluorescence analysis of primary murine microglia from B6, PLCG2M28L, and PLCG2P522R mice incubated with fluorescently labeled-Aβ1–42 aggregates (red). Cells were stained with Iba1 (microglia, green) and DAPI (nuclei, blue). Quantification results of Aβ uptake by fluorescence per cell are shown (5 experiments). All data are expressed as the mean values ± SEM and analyzed by an ordinary one-way ANOVA and Tukey’s multiple comparisons test (*P < 0.05, **P < 0.01, and ***P < 0.001; ns: not significant). Male mice: •; female mice: ∘. See also Figure S2.