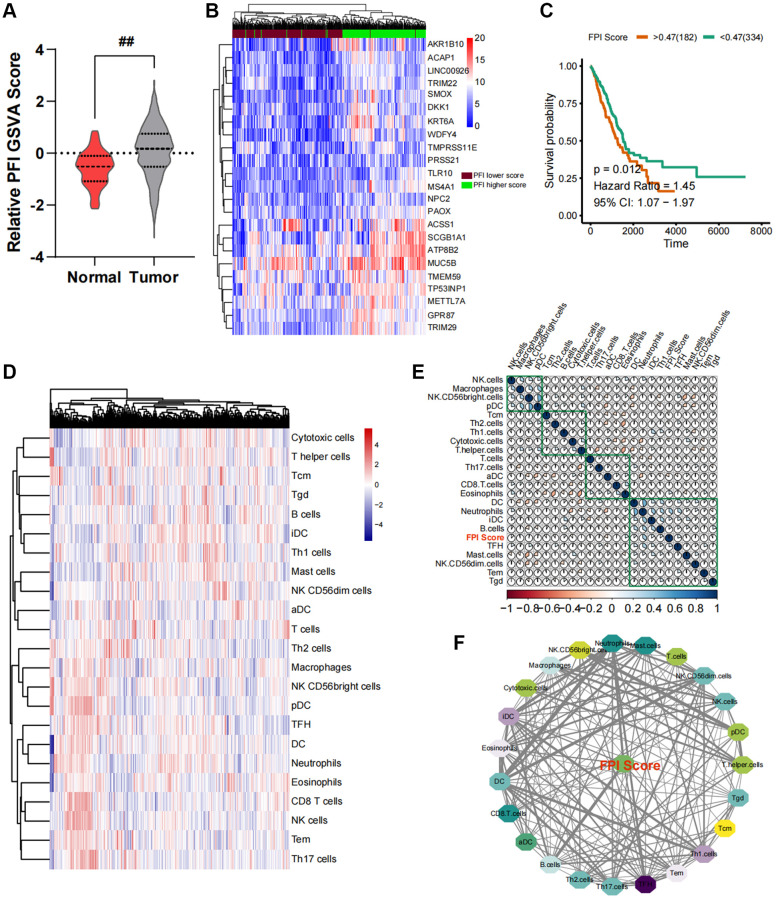
Figure 1.
Construction of an interaction network between the ferroptosis index (FPI) and the cancer immune microenvironment. (A) Variance analysis of standardized FPI between normal and cancer tissues in lung cancer. (B) Changes in the expression profile of ferroptosis-related genes. (C) Survival analysis and post-analysis of standardized FPI. (D) Analysis of immune cell infiltration in lung cancer tissues and relative expression abundance. (E) Correlation heat map of relative infiltration values of local immune cells and FPI. (F) Analysis of strongly associated immune cell subpopulations by Pearson correlation, with FPI as the core of regulation.

