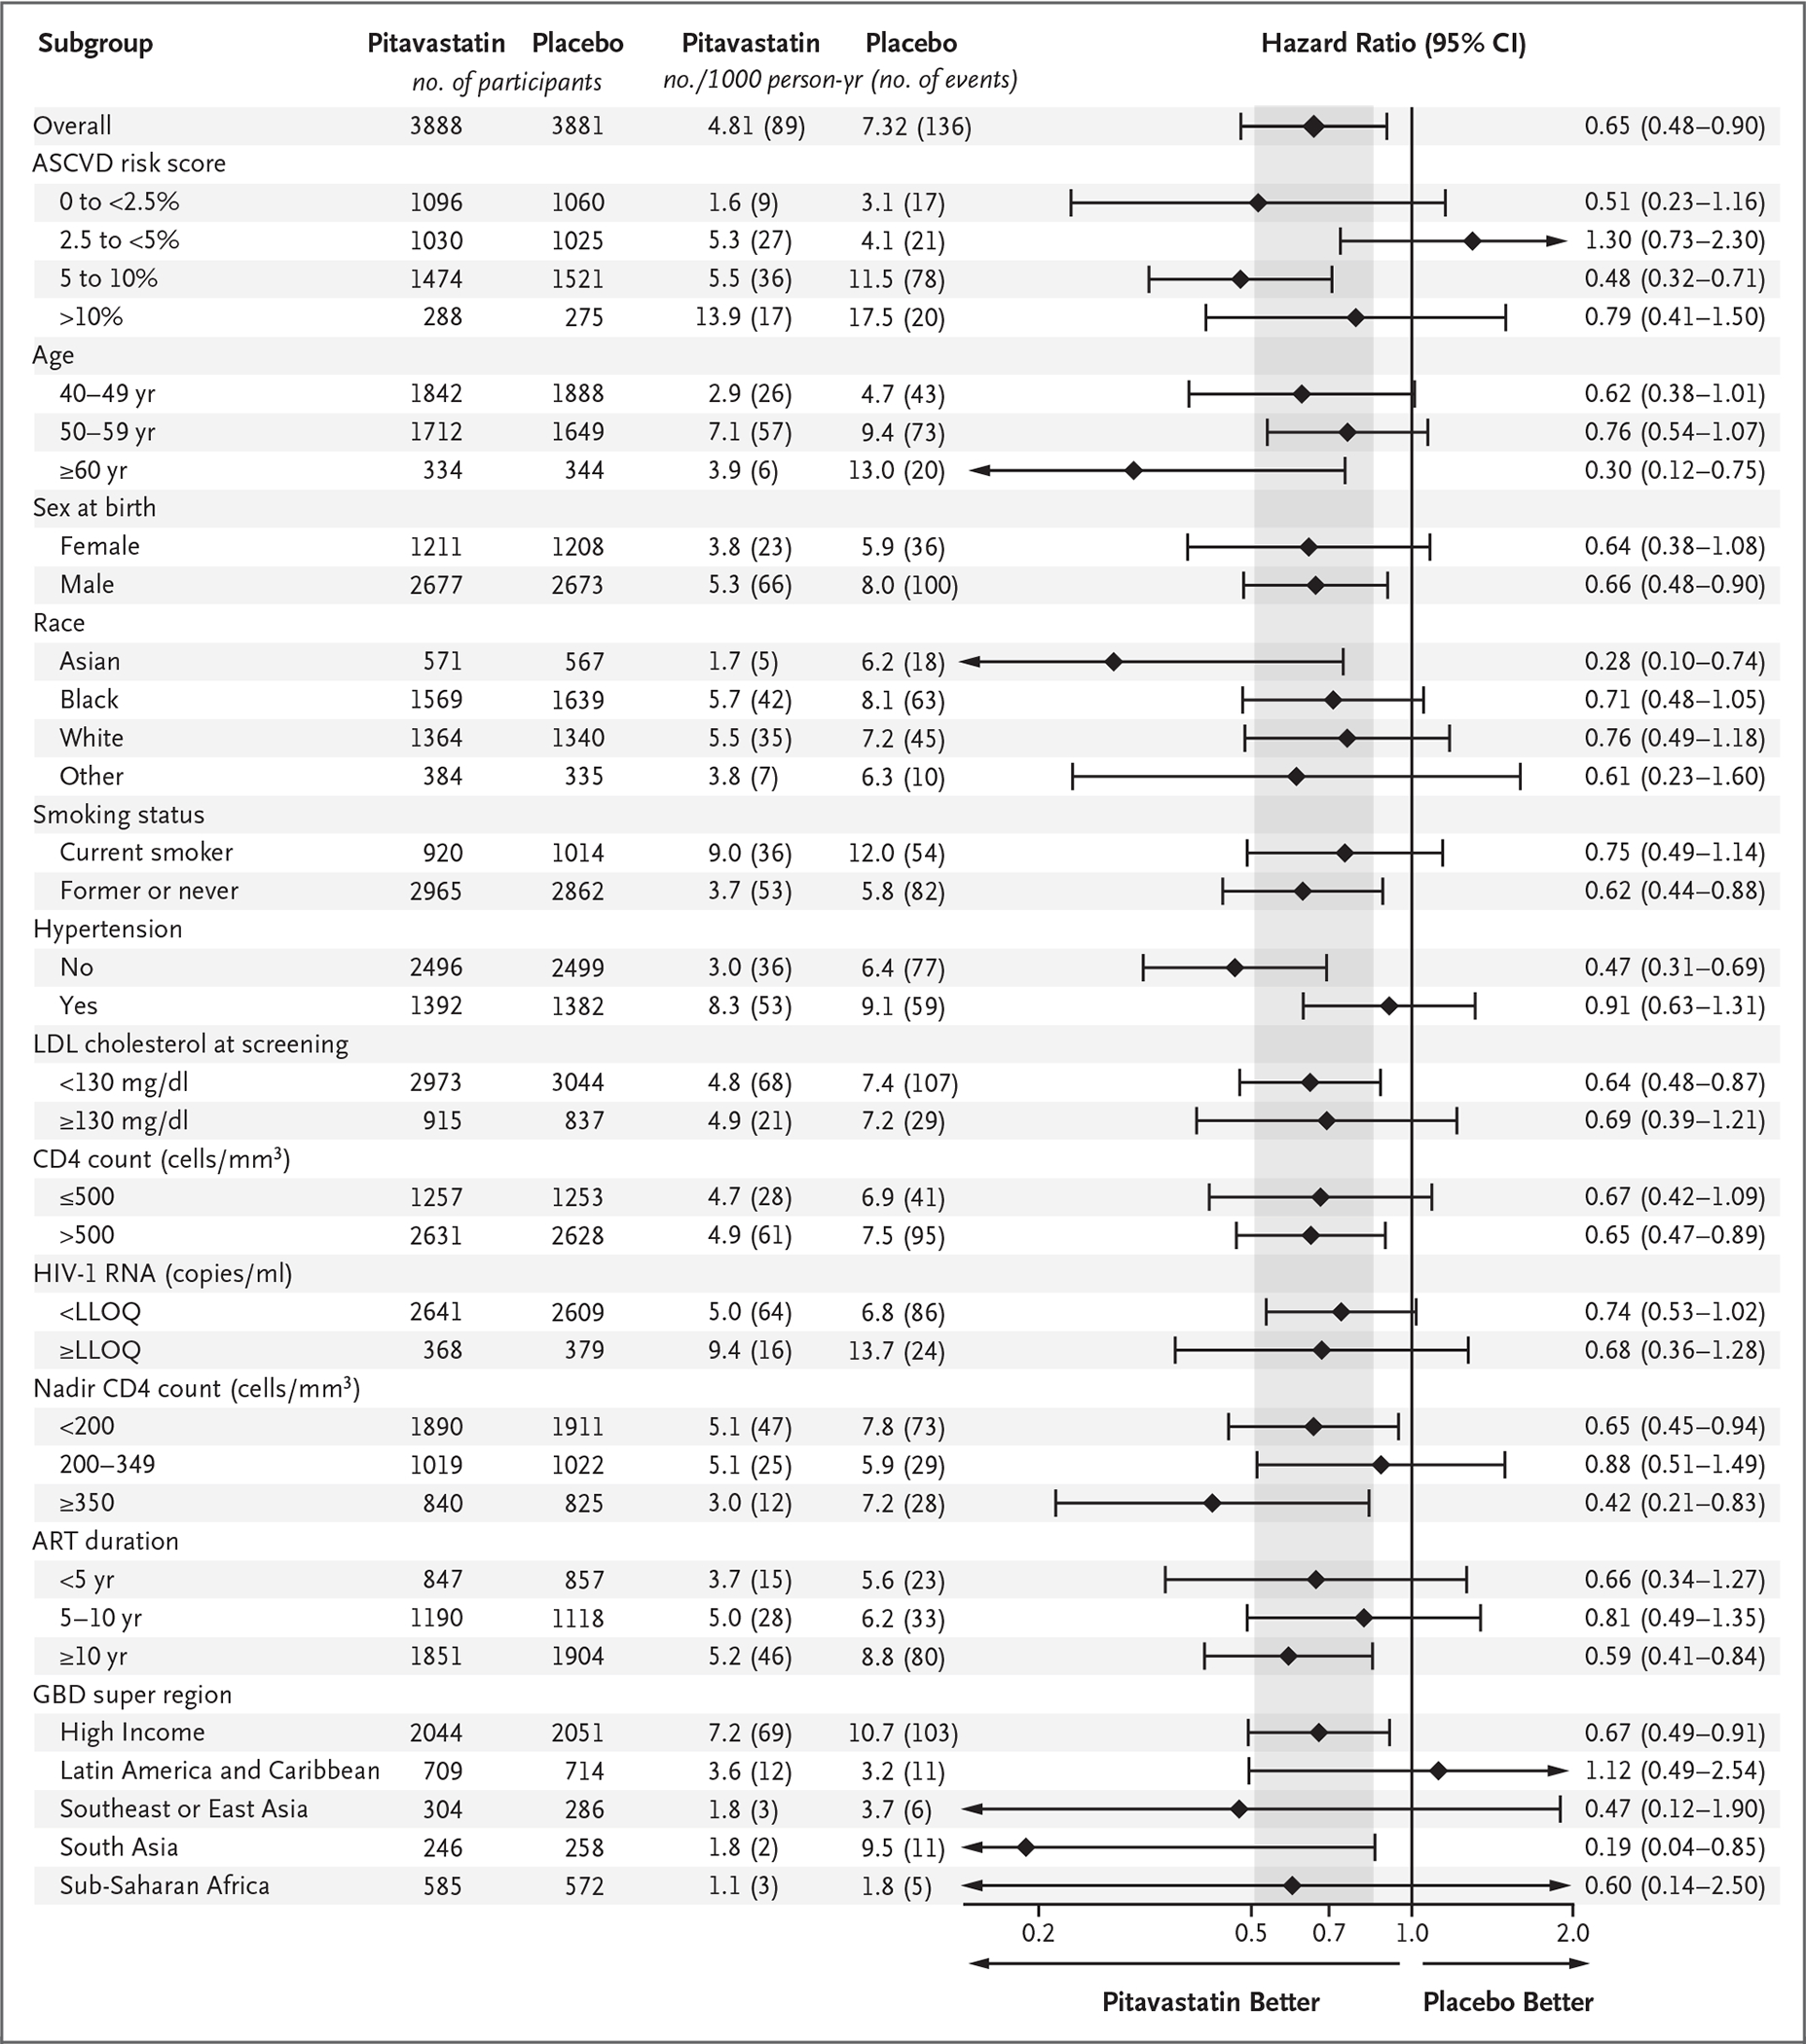
Figure 2. Treatment Effect on First MACE in Predefined Subgroups.

Each subgroup factor was included individually in a cause-specific Cox proportional-hazards model that was stratified according to sex at birth and the CD4 count at screening. For reference, the overall treatment effect in the primary analysis is shown at the top of the graph. The widths of the confidence intervals have not been adjusted for multiplicity and therefore may not be used in place of hypothesis testing. The 95% confidence intervals in subgroups with small numbers of events have been truncated, as indicated by arrows. To convert the values for cholesterol to millimoles per liter, multiply by 0.02586. ART denotes antiretroviral therapy, ASCVD atherosclerotic cardiovascular disease, GBD global burden of disease, LDL low-density lipoprotein, and LLOQ lower limit of quantification.
