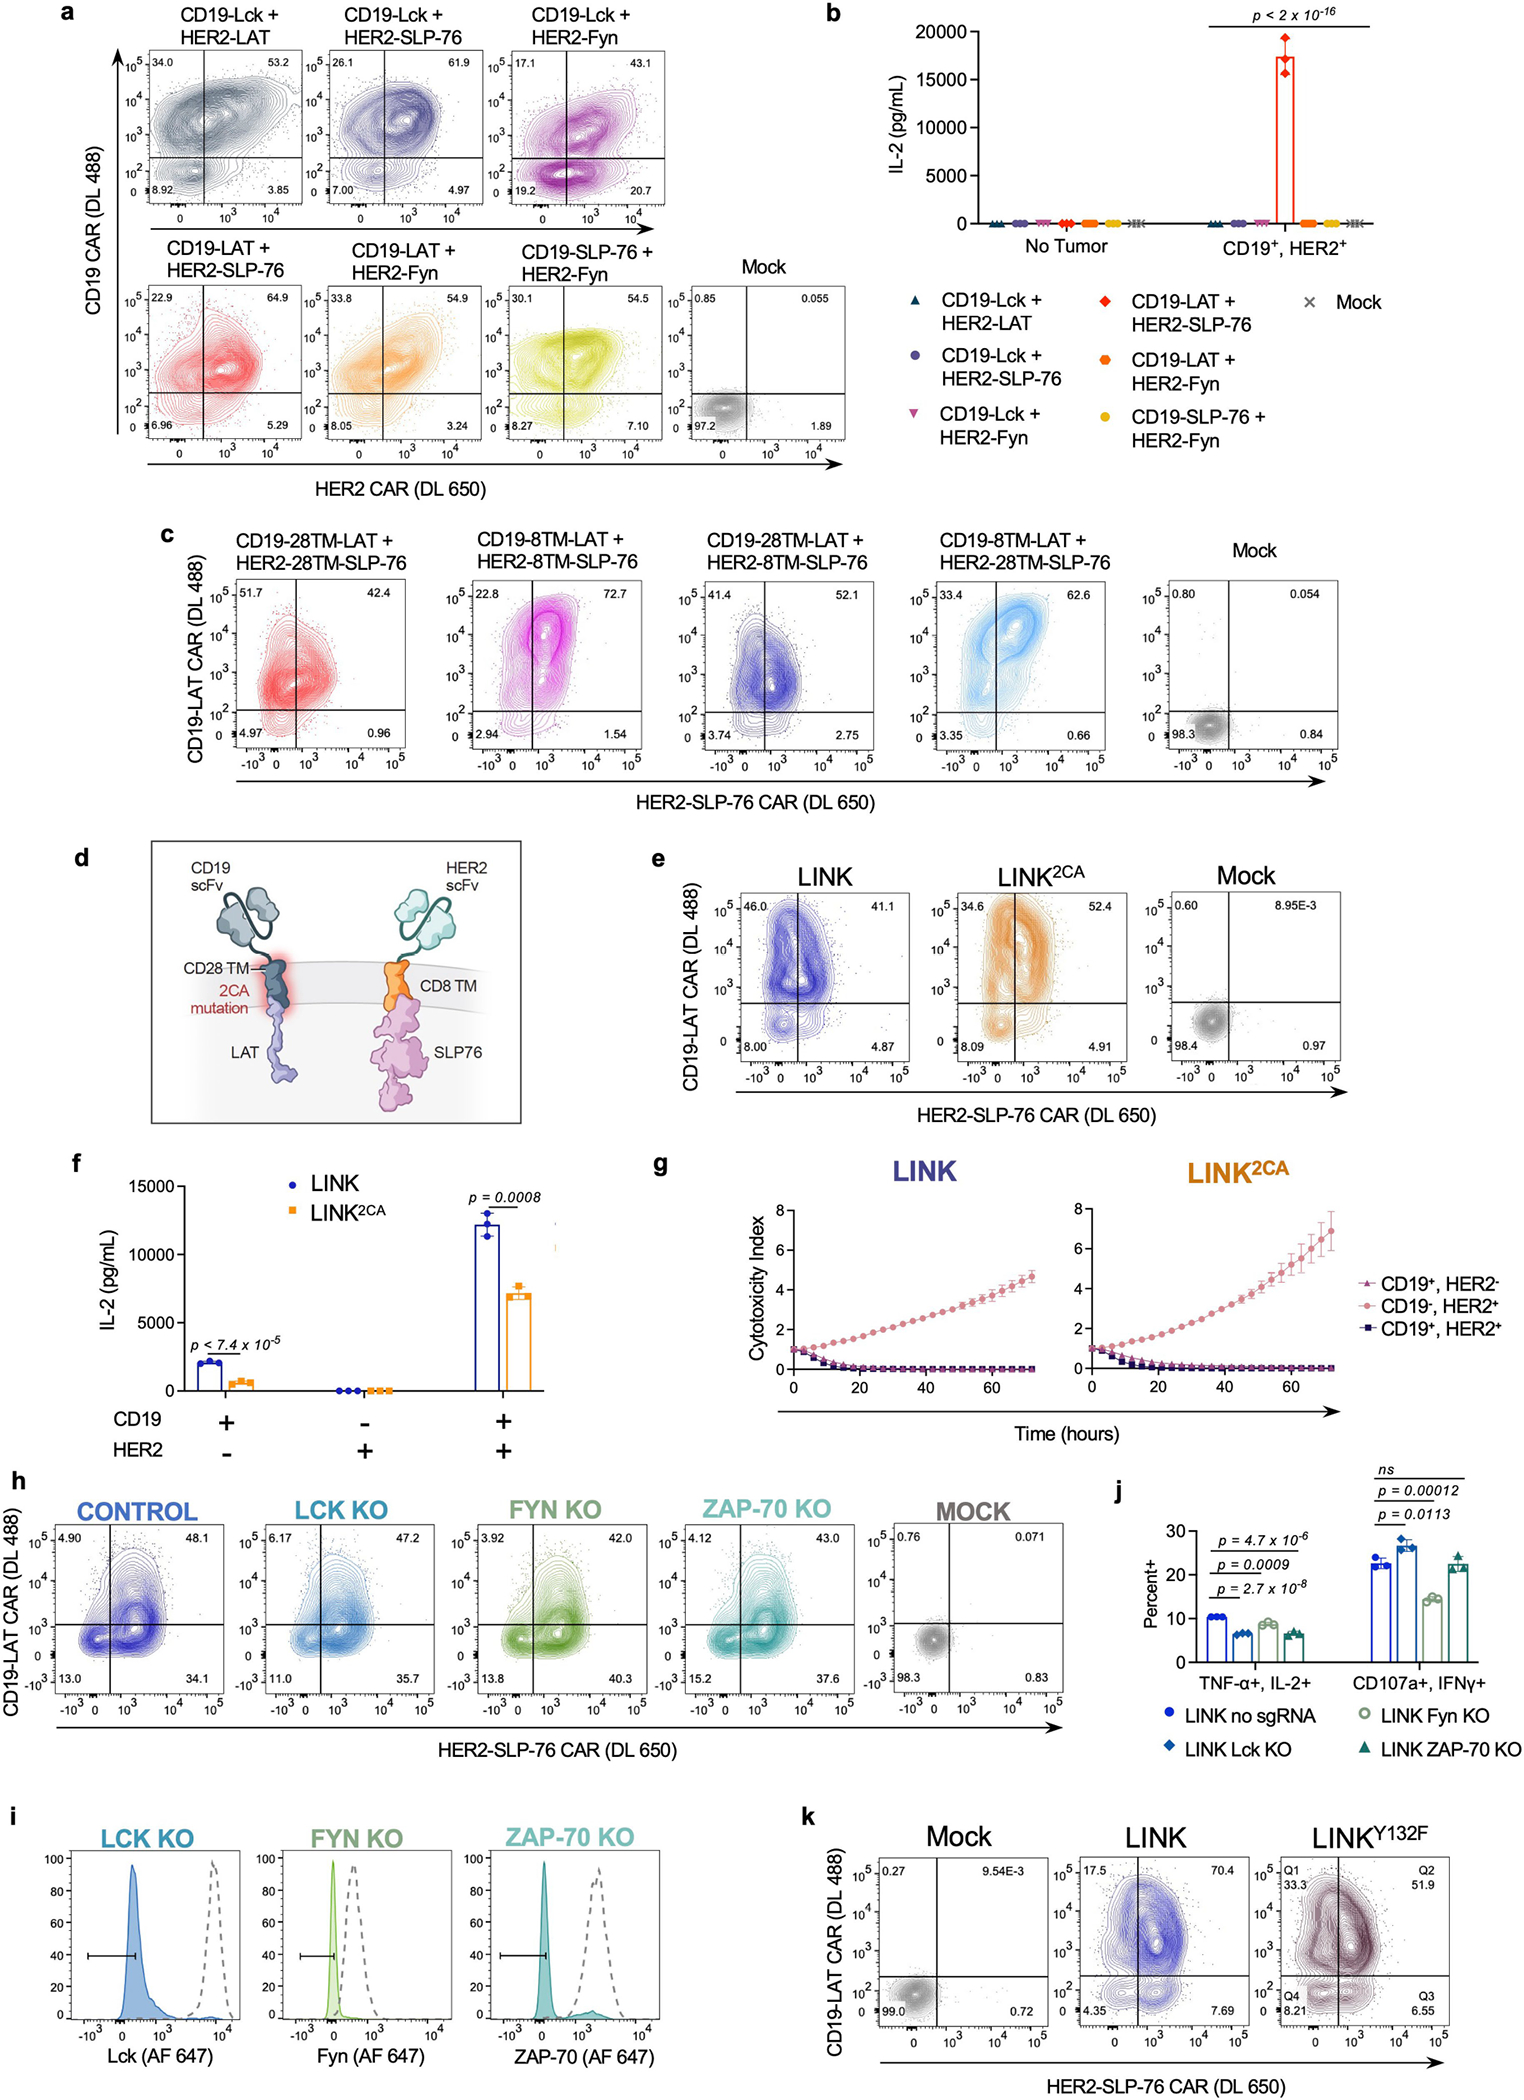
Extended Data Fig. 6 |. LAT and SLP-76 CARs jointly mediate T cell activation.

a, Flow cytometric data exhibiting CAR expression of co-transduced CD19 and HER2 proximal signalling CAR (LCK, FYN, LAT, and SLP-76) combinations. b, IL-2 secretion (as measured by ELISA) by T cells shown in a following co-culture with CD19+HER2+Nalm6 cells. Shown are mean values ± s.d. of three experimental replicates. Representative of four experiments performed with three different blood donors. Statistical comparisons performed with one-way ANOVA with correction for multiple comparisons (p < 2 × 10⁻¹⁶ for all comparisons to CD19-LAT + HER2-SLP-76). c, Flow cytometric expression of LAT and SLP-76 CARs on T cells utilized in Fig. 4f,g. d, Schematic illustrating incorporation of a dual Cysteine-to-Alanine (2CA) mutation in the CD28 hinge–TM domain of the LAT CAR component of the LINK system. e, Flow cytometric data exhibiting LINK CAR (±2CA mutation) expression. f,g, IL-2 secretion (f) and tumour cell killing (g) by LINK CAR T cells (±2CA mutation) following co-culture with indicated cell lines. Shown are mean values ± s.d. of three experimental replicates. Representative of eight independent experiments performed with five different blood donors. Comparisons in f performed with unpaired t-test (two-tailed). h, Flow cytometric data exhibiting LINK CAR (CD19-28TM-LAT + HER2-8TM-SLP-76) expression in unedited and edited T cells before stimulation with CD19+HER2+ Nalm6. i, Flow cytometric plots demonstrating knockout efficiencies for proximal signalling molecules in CAR T cells utilized in Fig. 4h,i. j, Quantification of TNF+IL-2+ and CD107a+IFNγ+ populations as shown in Fig. 4h,i. Baseline measurements from the unstimulated controls were subtracted from the stimulated conditions. Shown are mean values ± s.d. of three experimental replicates. Comparisons were performed via one-way ANOVA with correction for multiple comparisons. Representative of two independent experiments with different blood donors. k, Flow cytometric expression of LINK CAR (±LAT Y132F).
