
Extended Data Fig. 8 |. Testing ROR1-targeting CARs in a model of on-target, off-tumour toxicity.
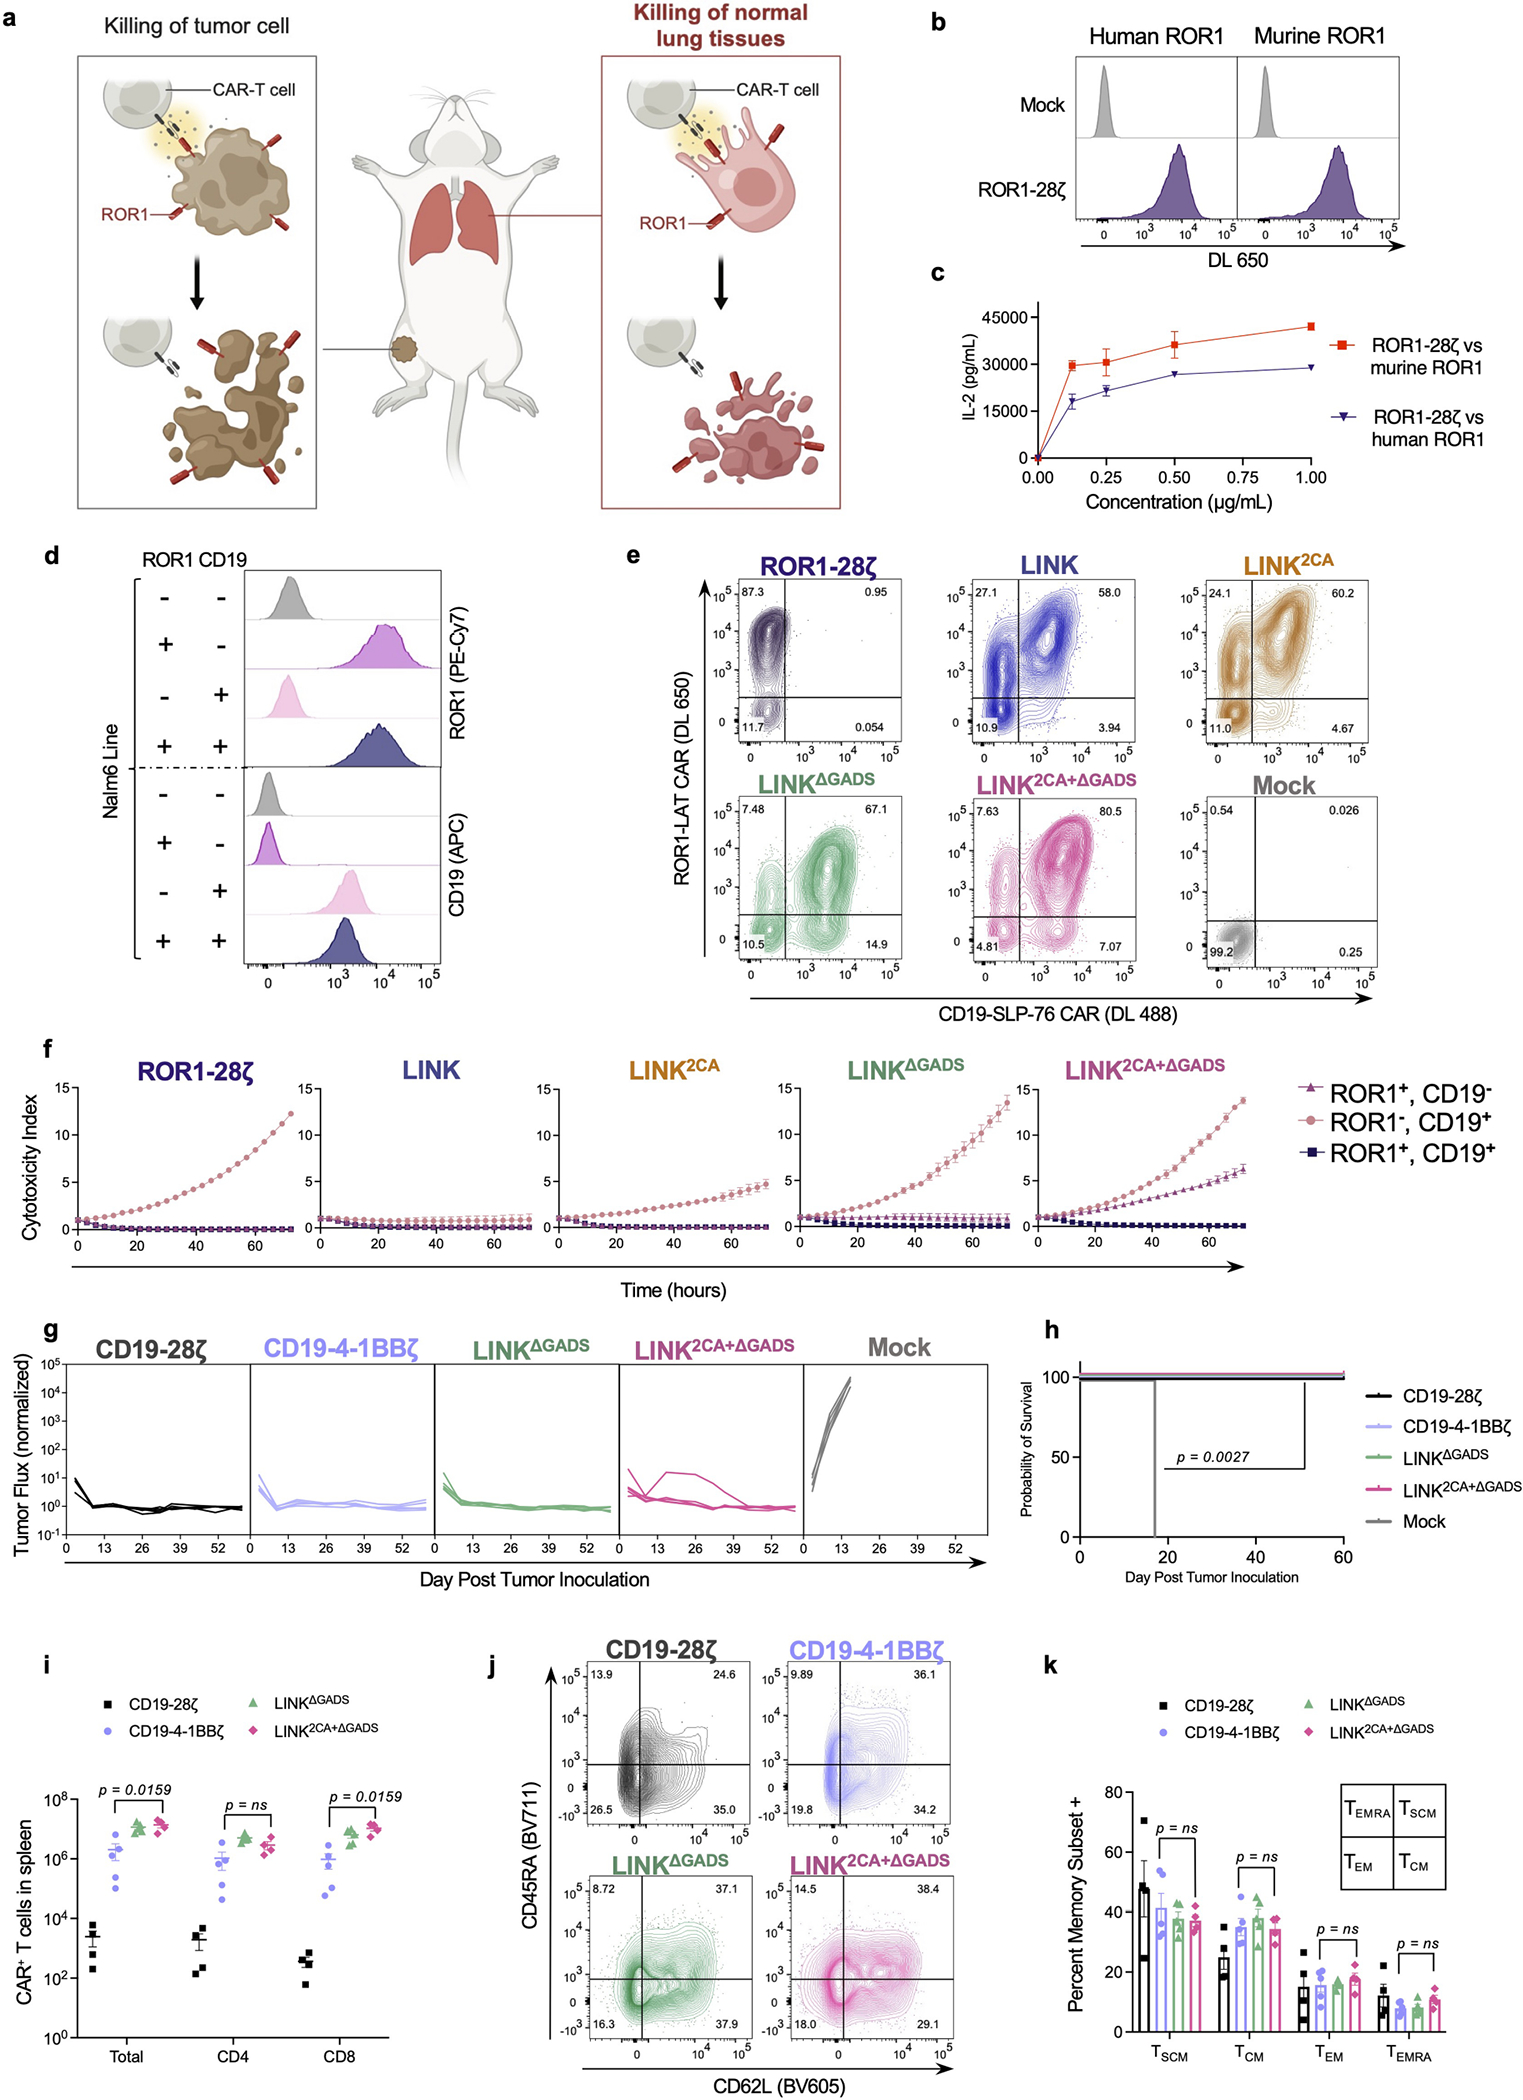
a, Schematic illustrating on-target, off-tumour toxicity in the lungs of tumour-bearing mice treated with ROR1 targeted CAR T cells. b, Flow cytometry plots exhibiting detection of ROR1-CD28ζ CAR on T cells with both recombinant human and mouse ROR1. c, IL-2 secretion (as measured by ELISA) by ROR1-CD28ζ CAR T cells after 24-h incubation with plate-bound human or mouse ROR1 protein at the indicated concentrations. Shown are mean values ± s.d. of three experimental replicates. Representative of three independent experiments with different blood donors. d, ROR1 and CD19 expression on single/double antigen positive Nalm6 lines used for experiments. e, Flow cytometric expression of ROR1-CD28ζ and indicated ROR1-and-CD19-targeted LINK CARs on T cells. f, Tumour cell killing of cell lines shown in d when co-cultured with the indicated CAR T cells at a 2:1 ratio of T cells to tumour cells. Shown are mean values ± s.d. of three experimental replicates. Representative of four independent experiments performed with two different blood donors. g,h, NSG mice bearing ROR1+CD19+Nalm6-luciferase were treated with 3 × 10⁶ CD19-CD28ζ, CD19–4-1BBζ, or indicated LINK CAR T cells 3 days after tumour inoculation. g, Quantification of tumour progression for each individual mouse as measured by flux values acquired by BLI, normalized to tumour-free mice. h, Survival curves for mice bearing tumours shown in g. Performed once with n = 5 mice per group. Comparisons performed by the log-rank test. i–k, NSG mice bearing ROR1+CD19+Nalm6-luciferase were treated with 8 × 10⁶ of the indicated CAR+ T cells three days after tumour inoculation. i, Absolute number of CAR+ T cells recovered from spleens on day 28 post treatment. j, Representative flow cytometric plots and k, quantification of CAR+ T central memory cells (TCM, CD45RA−CD62L+), T stem cell memory cells (TSCM, CD45RA+CD62L+), T effector memory cells (TEM, CD45RA−CD62L−), and T effector memory CD45RA+ cells (TEMRA, CD45RA+CD62L−) recovered from the spleens on day 28 post treatment. Data shown in i,k are mean values ± s.e.m. Performed one time with n = 5 mice (CD19–4-1BBζ and LINKΔGADS) or n = 4 mice (CD19-CD28ζ and LINK2CA+ΔGADS) per group. Comparisons made with the Mann–Whitney test (two-tailed).