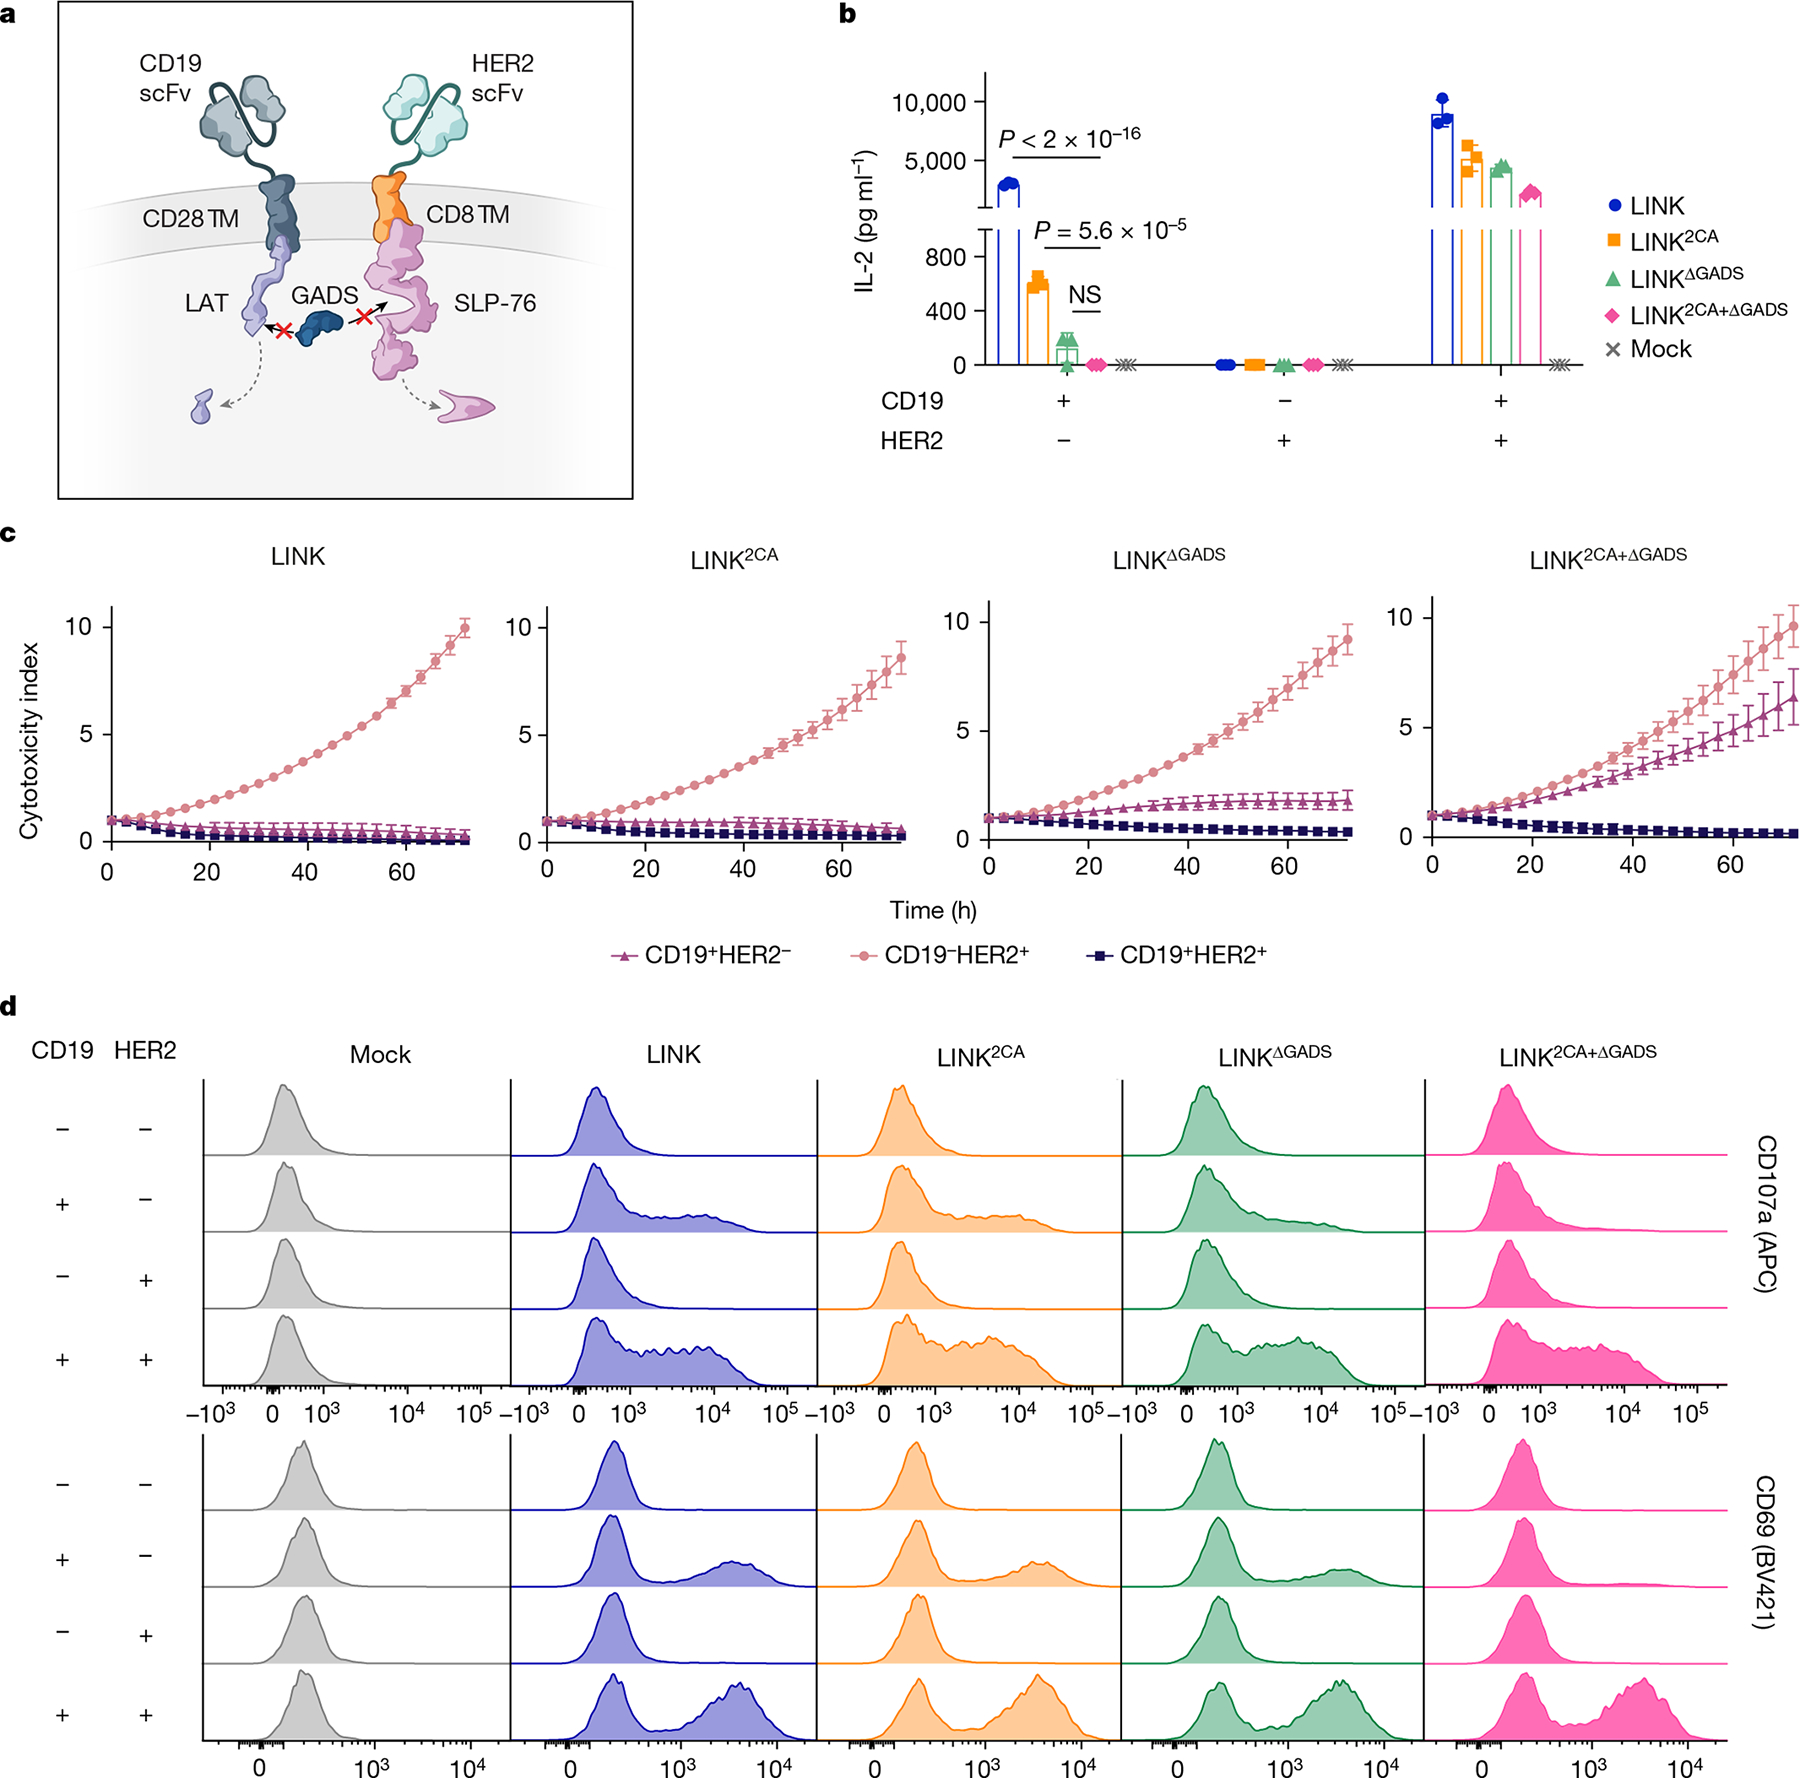
Fig. 5 |. Targeted mutations establish LINK CAR specificity.

a, Schematic of the deletion of the GADS-binding regions in LAT and SLP-76 CAR endodomains. b–d, IL-2 secretion (b), tumour cell killing (1:1 E:T) (c) and flow cytometric plots of T cell degranulation (CD107a, top) and activation (CD69, bottom) (d) for the indicated LINK CAR T cells after co-culture with the cell lines shown in Fig. 4c. Data in b,c are mean b1x s.d. of three experimental replicates. Data in b–d are representative of five independent experiments with four blood donors. Statistical comparisons were performed using one-way ANOVA with correction for multiple comparisons. NS, not significant.
