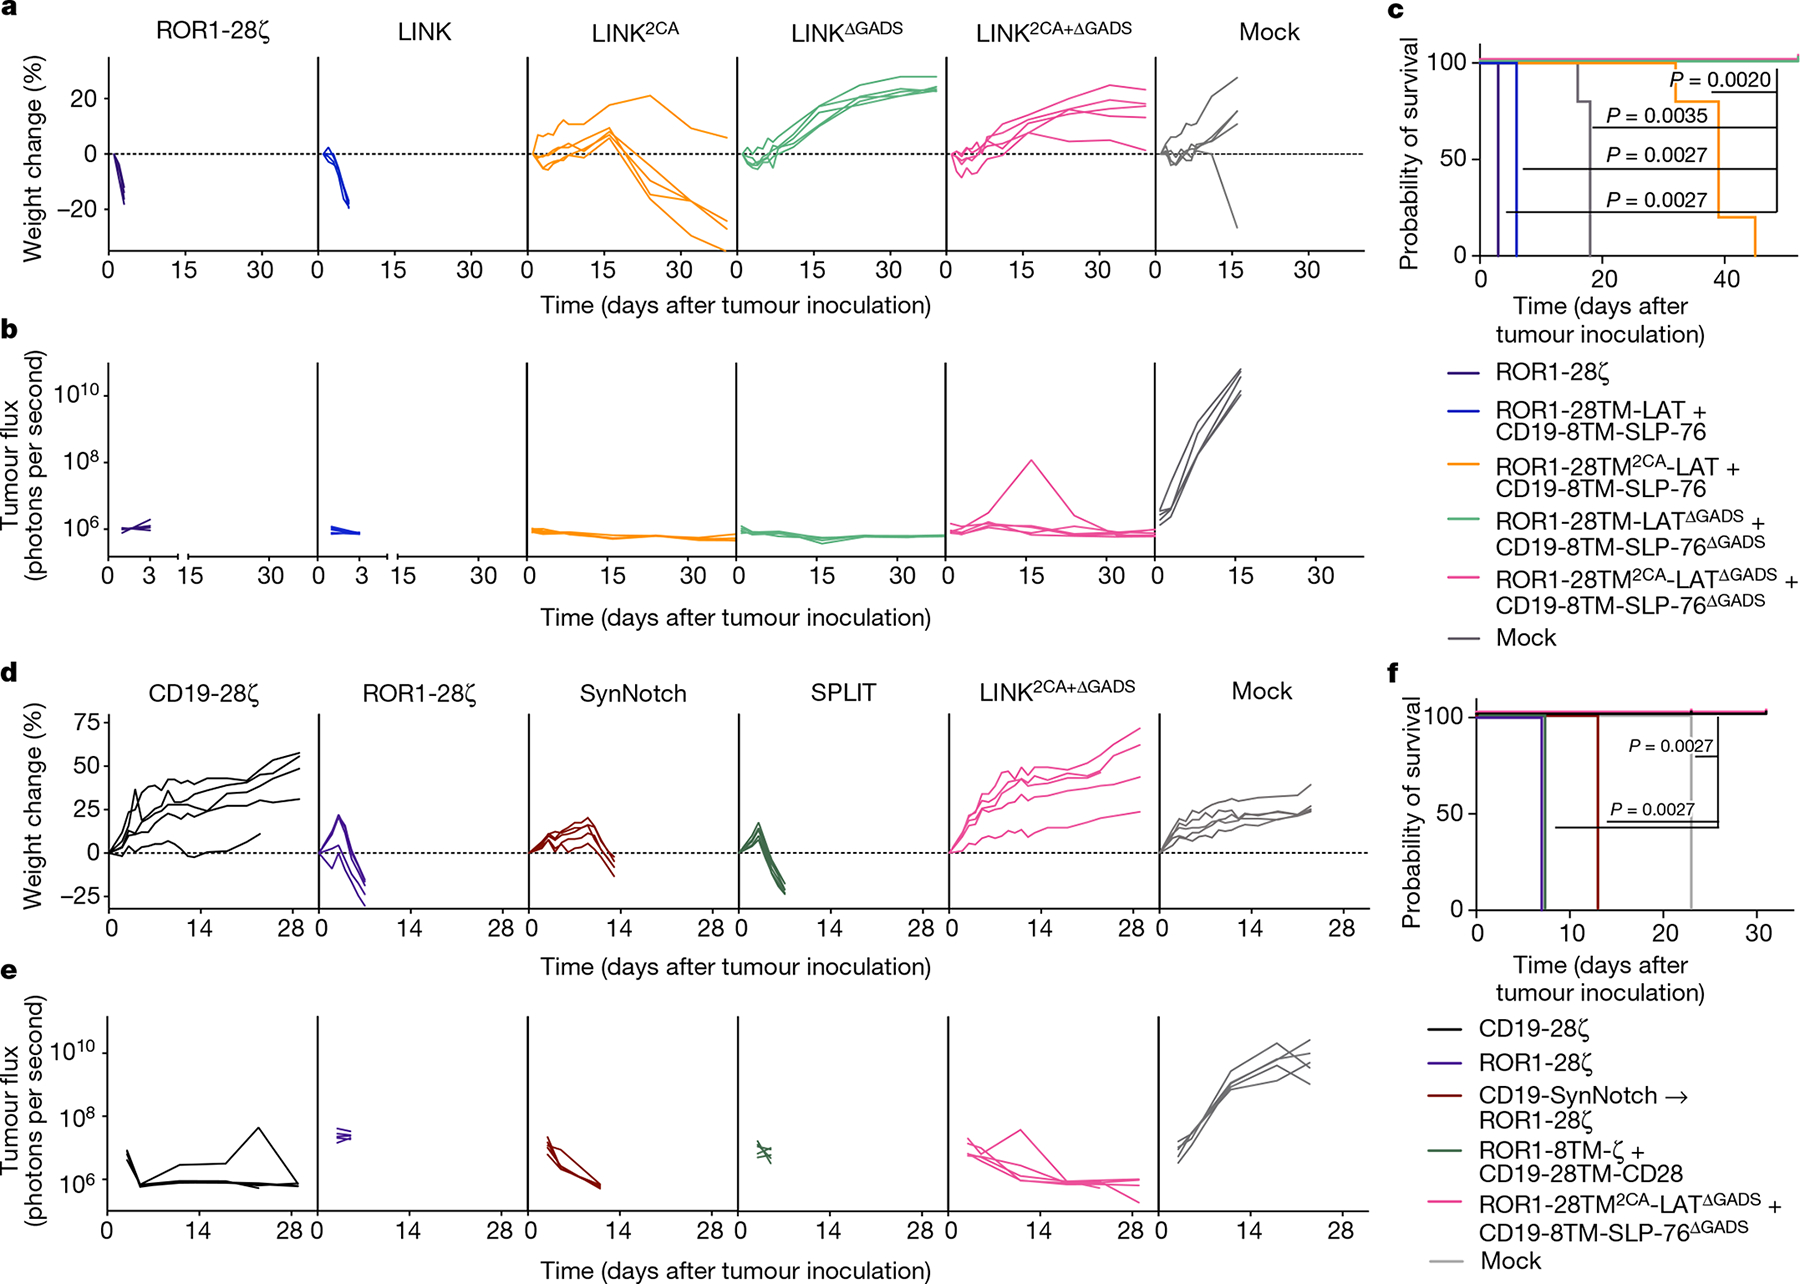
Fig. 6 |. LINK CAR mediates tumour eradication while preventing on-target, off-tumour toxicity.

a–c, NSG mice bearing ROR1+CD19+Nalm6-luciferase were treated with 6 × 10⁶ of the indicated CAR+ T cells on day 1 after tumour engraftment. a, Weight of individual mice over time plotted as a percentage of the weight on day 0. b, Quantification of tumour progression for each individual mouse as measured by flux values acquired with BLI. c, Survival curves for mice bearing tumours shown in a,b. Data in a–c are representative of three independent experiments with two different donors; n = 5 mice per group per experiment. In one of three experiments, the LINK2CA mice did not lose enough weight to meet the criteria for euthanasia. d–f, NSG mice bearing ROR1+CD19+Nalm6-luciferase were treated with 8 × 10⁶ of the indicated CAR+ T cells and logic-gated CAR T cell systems (including SPLIT (ROR1-8TM-ζ + CD19-28TM-CD28) and SynNotch (CD19-SynNotch → ROR1-CD28ζ)) on day 3 after tumour engraftment. d, Weight of individual mice over time plotted as a percentage of the weight on day 0. e, Quantification of tumour progression for each individual mouse as measured by flux values acquired with BLI. f, Survival curves for mice bearing tumours shown in d,e. The experiment in d–f was performed once with n = 5 mice per group and was repeated with another donor with all groups except CD19-CD28ζ (Extended Data Fig. 10e–g). Statistical comparisons were performed using log-rank test (c,f).
