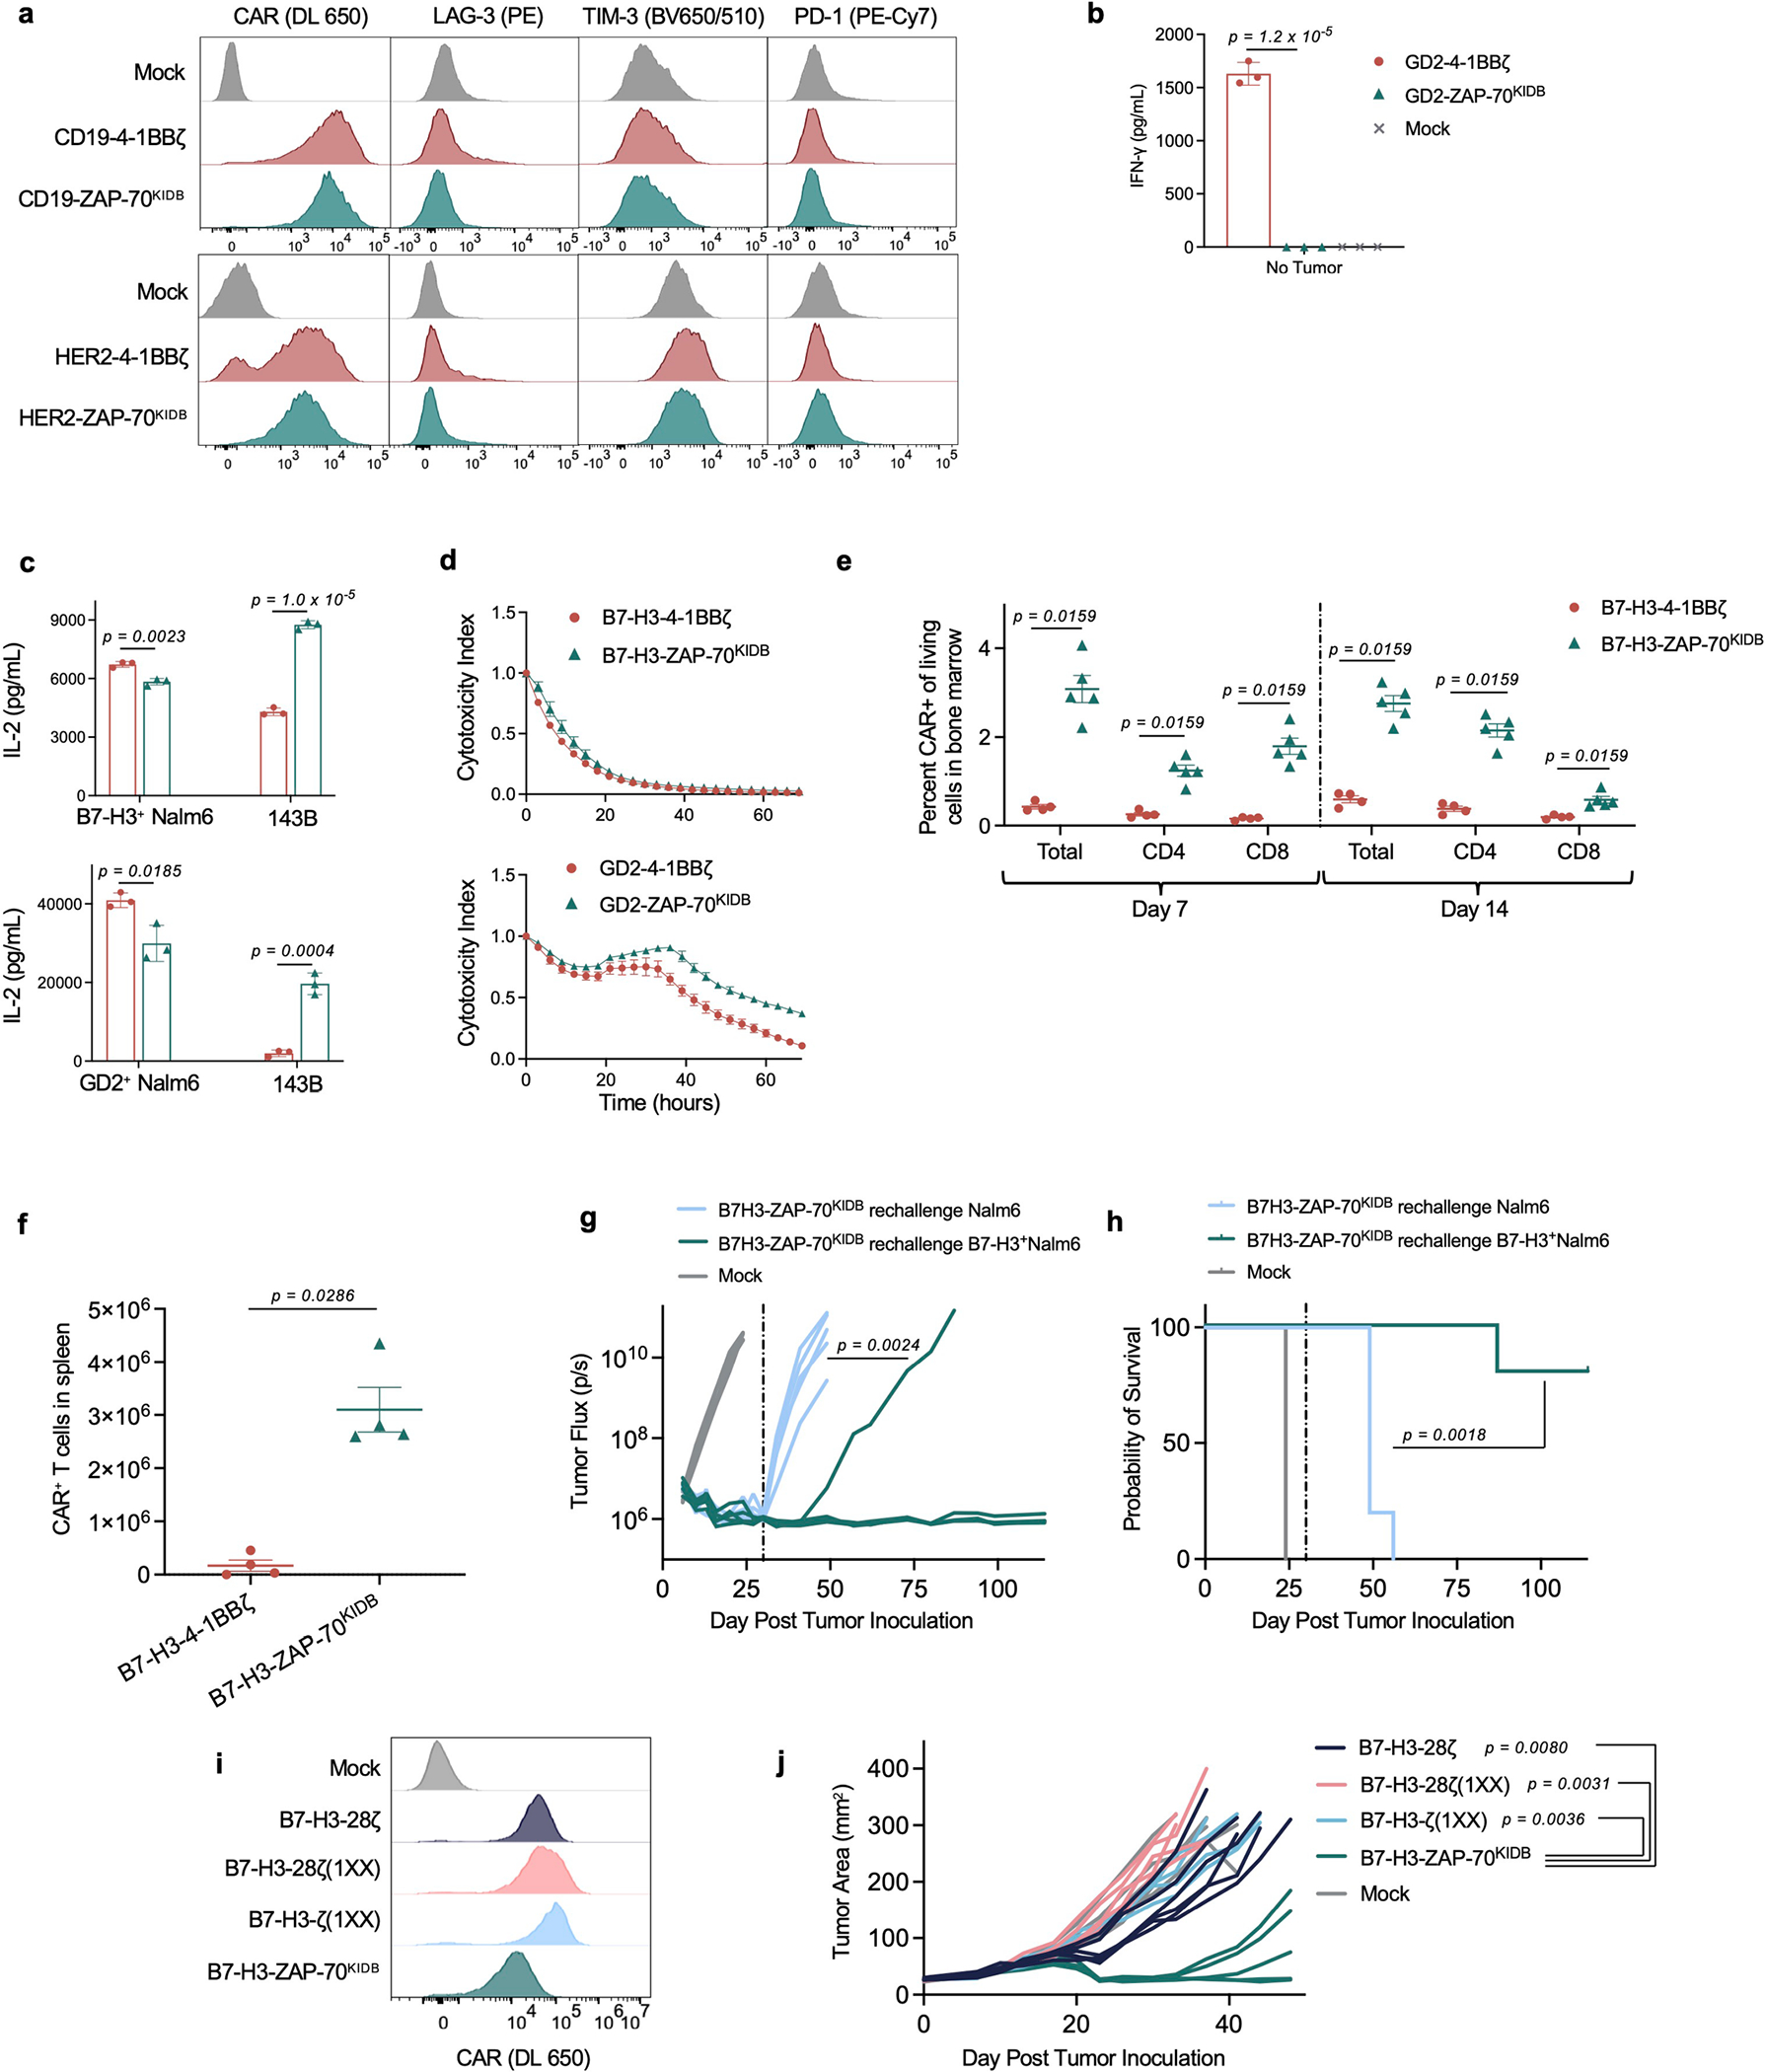
Extended Data Fig. 2 |. ZAP-70 CAR T cells show potent in vitro and in vivo activity.

a, Representative flow cytometric plots of CAR, LAG-3, TIM-3, and PD-1 expression for T cells bearing CD19 or HER2-specific CARs containing 4-1BBζ or ZAP-70KIDB endodomains (day 10 after T cell activation). Representative of three experiments with different blood donors. b, IFNγ secretion (as measured by ELISA) by GD2-4-1BBζ and GD2-ZAP-70KIDB CAR T cells following 24-h culture in the absence of target cells. Shown are mean values ± s.d. of three experimental replicates. Representative of three experiments with different blood donors. Groups were compared with the unpaired t-test (two-tailed). c, IL-2 secretion by B7-H3 or GD2-specific CAR T cells containing ZAP-70KIDB or 4-1BBζ endodomains following co-culture with Nalm6 cells expressing B7-H3/GD2 or 143B osteosarcoma cells. Shown are mean values ± s.d. of three experimental replicates. Representative of four independent experiments with different blood donors. Groups were compared with the unpaired t-test (two-tailed). d, Tumour cell killing of GFP+ human neuroblastoma CHLA-255 cells co-cultured with B7-H3 or GD2-specific CAR T cells containing ZAP-70KIDB or 4-1BBζ endodomains at a 1:1 ratio of T cells to tumour cells. Shown are mean values ± s.d. of three experimental replicates. Representative of four independent experiments with different blood donors. e, Percent CAR+ T cells recovered from the bone marrow of CHLA-255-bearing mice on days 7 and 14 after treatment with 1 × 10⁷ B7-H3-4-1BBζ or B7-H3-ZAP-70KIDB CAR T cells 7 days after tumour inoculation. Shown are mean values ± s.e.m. for n = 5 mice (B7-H3-ZAP-70KIDB) or n = 4 mice (B7-H3-4-1BBζ) per group per time point. Experiment was performed once at two time points. Groups were compared with the Mann–Whitney test (two-tailed). f, Absolute number of CAR T cells recovered from the spleens of CHLA-255-bearing mice on day 28 after treatment with 1 × 10⁷ B7-H3-4-1BBζ or B7-H3-ZAP-70KIDB CAR T cells. Shown are mean values ± s.e.m. for n = 4 mice. Experiment was performed once. Groups were compared with the Mann–Whitney test (two-tailed). g,h, NSG mice bearing CHLA-255-luciferase xenografts were treated intravenously with 3 × 10⁶ B7-H3-ZAP-70KIDB CAR T cells on day 7 post CHLA-255 engraftment, then rechallenged with B7-H3+Nalm6-luciferase or WT B7-H3−Nalm6-luciferase leukaemia lines on day 30 post initial tumour engraftment (dashed vertical line). g, Quantification of tumour progression for each individual mouse as measured by flux values acquired by BLI. h, Survival curves for mice bearing tumours shown in g. Experiment was performed once with n = 5 mice per group. Tumour growth in g was compared between groups using repeated measures one-way ANOVA with correction for multiple comparisons and survival in h was compared with the log-rank test. i, Flow cytometric plots of CAR expression on B7-H3-CD28ζ, B7-H3-CD28ζ(1XX), B7-H3-ζ(1XX), or B7-H3-ZAP-70KIDB CAR T cells (day 10 after T cell activation). j, NSG mice bearing 143B osteosarcoma xenografts were treated intravenously with 1 × 10⁷ B7-H3-CD28ζ, B7-H3-CD28ζ(1XX), B7-H3-ζ(1XX), or B7-H3-ZAP-70KIDB CAR T cells on day 13 post tumour inoculation. Tumours were measured at least twice weekly, and tumour area was calculated as the product of the tumour width and depth. Experiment was performed one time with n = 5 mice per group (n = 6 mice for B7-H3-CD28ζ, n = 4 mice for B7-H3-ζ(1XX)). Tumour growth curves were compared with repeated measures one-way ANOVA with correction for multiple comparisons.
