
Extended Data Fig. 3 |. ZAP-70KIDB CAR T cells show distinct transcriptomic profiles.
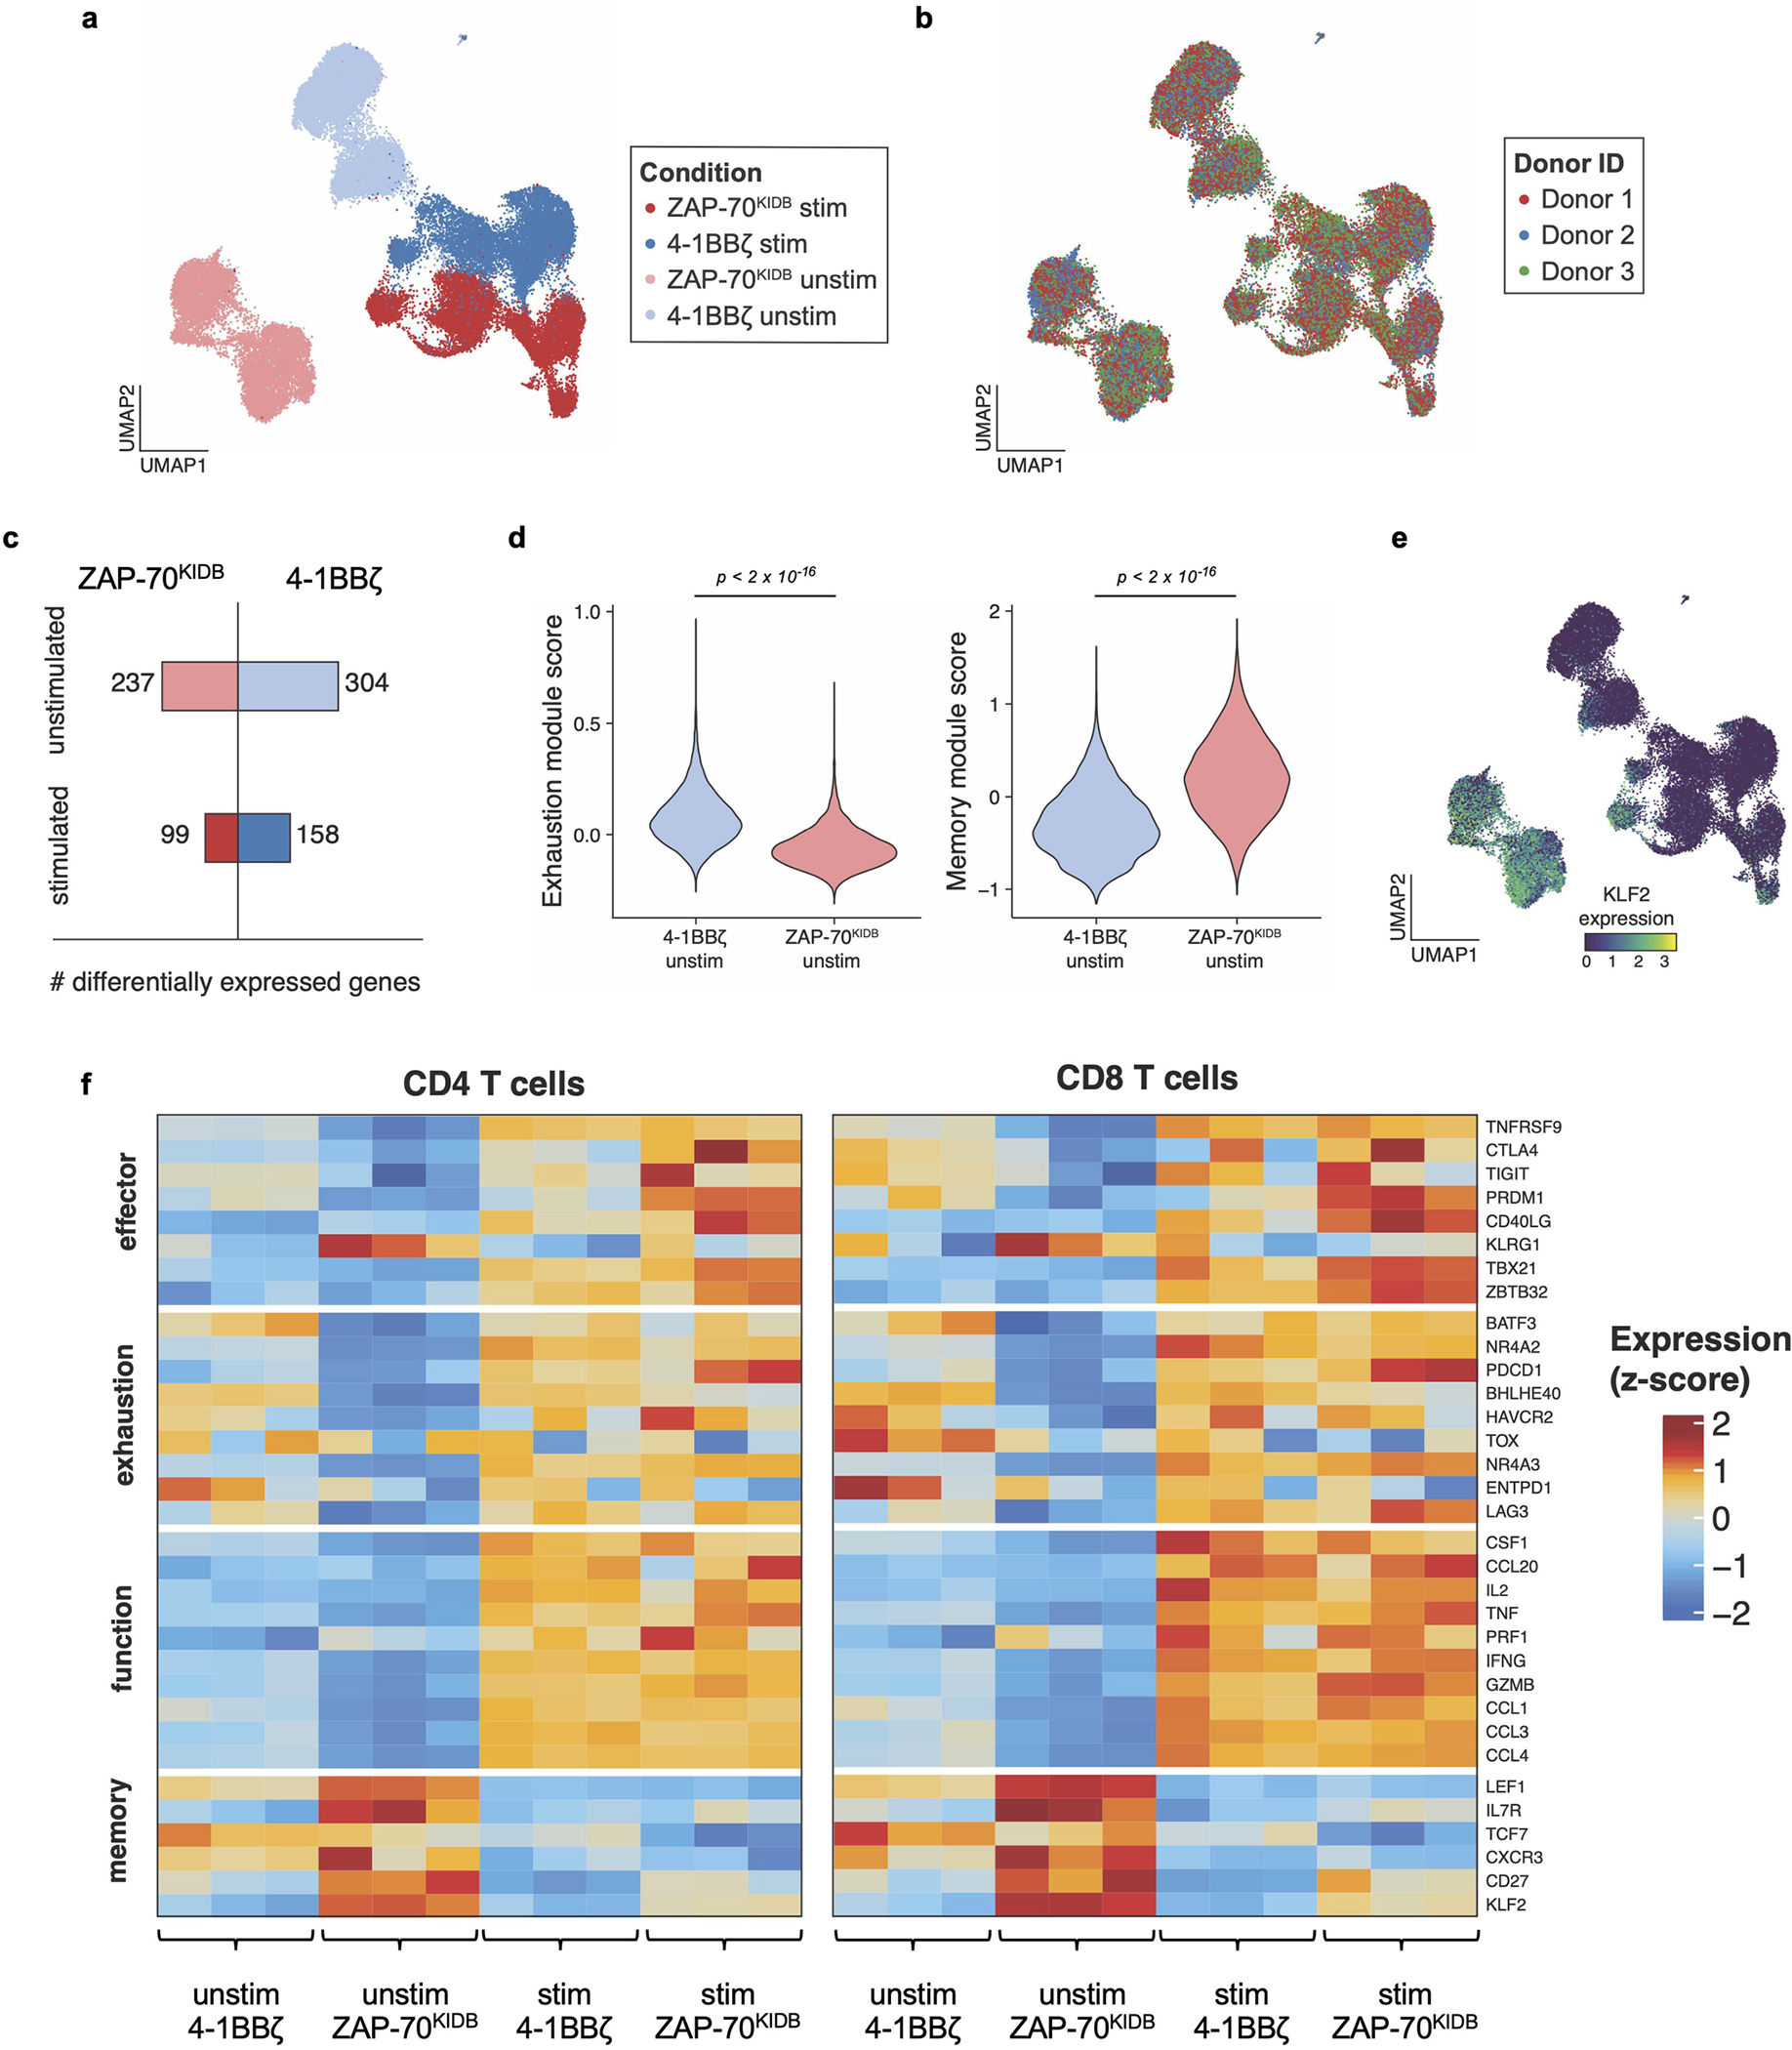
a, Uniform manifold approximation and projection (UMAP) embedding visualization showing overlaid B7-H3-4-1BBζ versus B7-H3-ZAP-70KIDB CAR T cells ± stimulation with B7-H3+Nalm6. b, UMAP embedding visualization showing an overlay annotating the three CAR T cell donors. c, Numbers of differentially expressed genes in B7-H3-4-1BBζ versus B7-H3-ZAP-70KIDB CAR T cells ± stimulation with B7-H3+Nalm6. Differentially expressed genes were defined by a Benjamini–Hochberg adjusted p-value < 0.01 and abs(logFC) > 0.5 from Seurat’s FindMarkers function (two-sided Wilcoxon signed rank test). d, Violin plots characterizing single-cell gene expression modules for T cell exhaustion (left panel; n = 61 genes) and T cell memory signature (right panel; n = 69 genes) in unstimulated B7-H3-4-1BBζ versus B7-H3-ZAP-70KIDB CAR T cells. Module scores were computed using the FindModuleScores function in Seurat. Comparisons were performed with the Mann–Whitney (two-tailed) test. e, UMAP embedding analysis showing KLF2 expression in overlaid B7-H3-4-1BBζ versus B7-H3-ZAP-70KIDB CAR T cells ± stimulation with B7-H3+Nalm6. f, Heat map exhibiting differentially expressed subsets of genes associated with T cell effector, exhaustion, function, and memory signalling pathways in B7-H3-4-1BBζ versus B7-H3-ZAP-70KIDB CAR T cells ± stimulation with B7-H3+Nalm6.