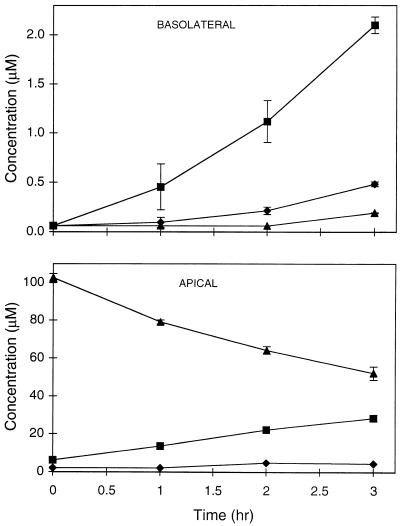
FIG. 2.
Time course of transport of bis(POC)-PMPA across Caco-2 monolayers represented as cumulative basolateral (top) and apical (bottom) concentrations of PMPA (⧫), mono(POC)-PMPA (▪), and bis(POC)-PMPA (▴) after the addition of 100 μM bis(POC)-PMPA to the apical side of the monolayers. The values are the means ± standard deviations for three independent experiments.

