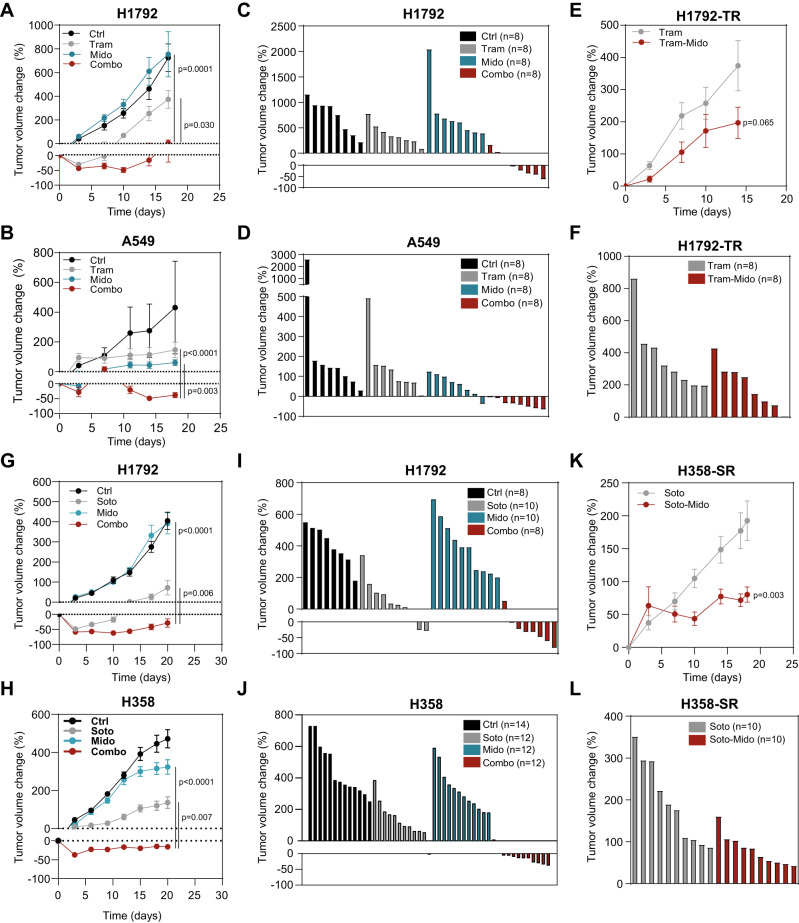
Fig. 5. Midostaurin-based drug combinations show antitumor effects on treatment naïve and resistant mut KRAS LUAD.
A, B Percent fold change growth of cell-derived tumors (CDXs) from H1792 or A549 cells treated with indicated drugs (Trametinib: 1 mg/kg; Midostaurin: 25 mg/kg). N = 8 tumors per group in Rag2-/-; Il2γr-/- mice (data: mean +/− SEM; test: Kruskal-Wallis, Dunn’s adjustment). C, D Waterfall plots of tumors from (A) and (B) at the last day of experiment. E Percent fold change of Tram-resistant (TR) H1792 CDXs treated with indicated drugs (Trametinib: 1 mg/kg; Midostaurin: 25 mg/kg). N = 8 tumors per group in Rag2-/-; Il2γr-/- mice (data: mean +/− SEM; test: Mann–Whitney). F Waterfall plot of tumors from (E) at the last day of experiment. G, H Percent fold change of CDXs from H1792 (G) or H358 (H) treated with indicated drugs. 30 mg/kg (H1792) and 10 mg/kg (H358); Mido: 25 mg/kg. N: 14 (ctrl) and 12 (Soto, Mido and Combo) tumors in Rag2-/-; Il2γr-/- mice data: mean +/− SEM; test: one-way ANOVA, Tukey’s adjustment). I, J Waterfall plot of tumors in (G) and (H) at the last day of experiment. K Percent fold change growth of Soto-resistant (SR) H358 CDXs treated with indicated drugs (Soto: 10 mg/kg; Mido: 25 mg/kg). N: 10 tumors per group in Rag2-/-; Il2γr-/- mice (data: mean +/− SEM; test: t-test). L Waterfall plot of tumors from (K) at the last day of experiment.

