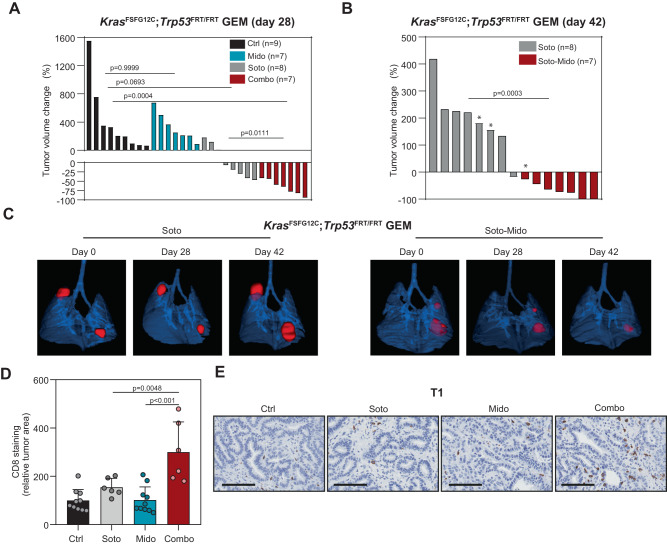
Fig. 6. Midostaurin potentiates the antitumor effect of Sotorasib in a GEM lung cancer model.
A Waterfall plot of lung tumors from the KrasG12C driven model (KrasFSFG12C; Trp53FRT/FRT mice) treated with the indicated drugs at day 28. N: number of tumors per group. Soto: 100 mg/kg; Mido: 25 mg/kg (test: Kruskal–Wallis, Dunn’s adjustment -all comparisons-; t-test -Soto vs combo-). B Waterfall plot graph of lung tumors from KrasFSFG12C; Trp53FRT/FRT mice at day 42 of treatment. *: units correspond to tumor volume change at day 28. N: number of tumors per group. Soto: 100 mg/kg; Mido: 25 mg/kg (test: Mann–Whitney). C Representative microCT images of lung tumors from KrasFSFG12C; Trp53FRT/FRT mice at different days of treatment. D Quantification of CD8 staining in tumors from T1-derived xenografts in F1 C57BL/6 x 129S4/Sv mice (7-day treatment). N: 10 tumor sections (ctrl and Mido); n: 6 tumor sections (Soto and Combo). Soto: 30 mg/Kg; Mido: 25 mg/kg (data: mean +/− SEM; test: one-way ANOVA, Tukey’s adjustment). E Immunohistochemistry images of tumors in (D) stained for CD8. Scale bar: 100 µM.

