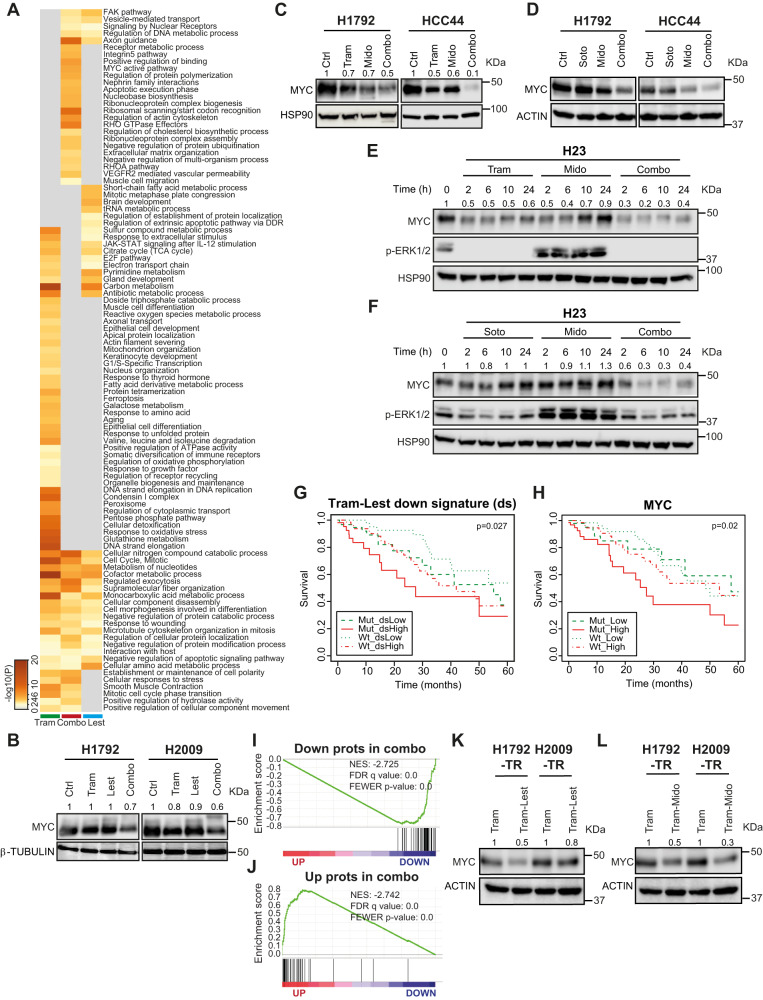
Fig. 7. MtPKCi-based drug combinations downregulate MYC protein.
A Heatmap of biological pathways enriched by the dysregulated proteins obtained from H1792 cell line 48 h after exposure to Trametinib (Tram), Lestaurtinib (Lest) or both, and generated by METASCAPE70. B, C MYC protein expression of H1792 and H2009 (B) or H1792 and HCC44 (C) cell lines treated for 48 h. β-TUBULIN (B) or HSP90 (C) are loading controls. Numbers correspond to relative MYC densitometry quantification. D MYC protein expression of H1792 and HCC44 cell lines treated for 48 h (loading control: ACTIN). E, F MYC and p-ERK1/2 protein expression of H23 cell line at different time points (loading control: HSP90). Numbers correspond to relative MYC densitometry quantification. G, H Kaplan–Meier plot showing overall survival of lung cancer patients from TCGA database as a function of the expression of the genes from the signature downregulated by the Tram and Lest combination (ds) and KRAS mutational status (G) or MYC expression and KRAS mutational status (H). I Gene set enrichment analysis (GSEA) of proteins downregulated by combined Tram and Lest treatment onto a ranked-order list from H1792-TR exposed to Tram compared to those cells treated with the drug combination. J GSEA of proteins upregulated by combined Tram and Lest treatment onto the same ranked-order list from (I). K, L MYC protein expression in Tram-resistant H1792 and H2009 cell lines after 48 h drug treatment (loading control: ACTIN). Numbers correspond to relative MYC densitometry quantification.

