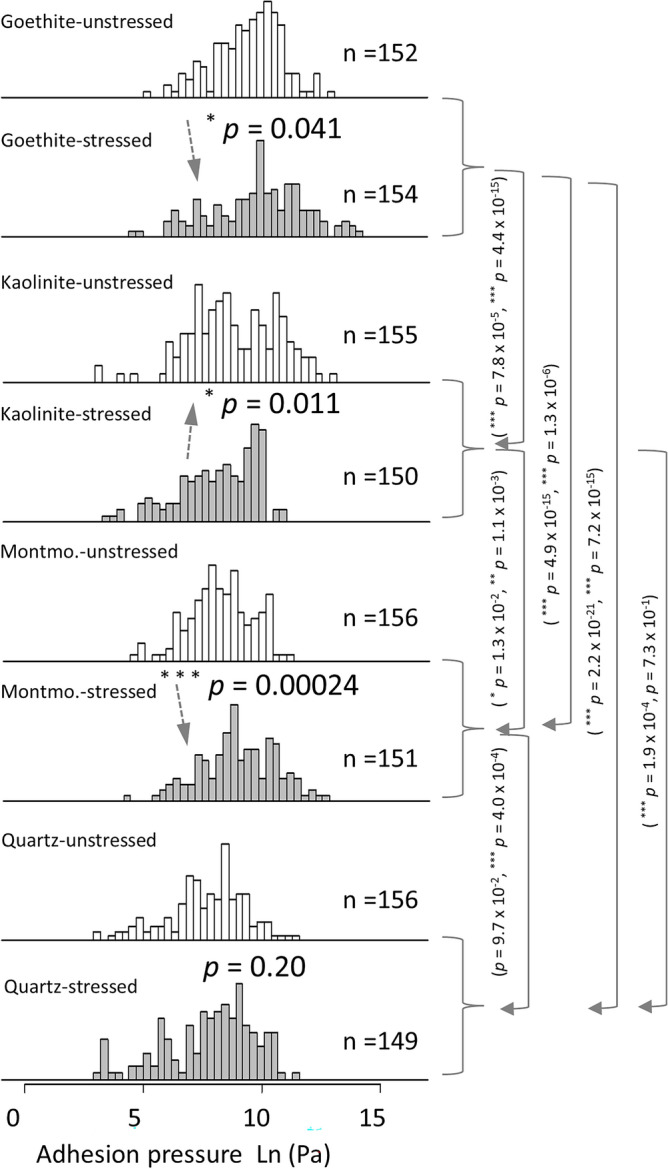
Figure 4.

Frequency distributions of adhesion pressures of cell-mineral interactions between cells of two independent unstressed and three independent stressed P. fluorescens cultures and five individual functionalized tips for each mineral (Fig. 2d) in 10 mM KNO3 solution. A set of ~ 30 FD curves for each tip with 1 s contact time and 5 nN applied force was made. The solid arrows highlight significant differences in adhesion pressures between the minerals (with p vales for unstressed and stressed separated by “,”) while the dashed arrows show the effect of stress on adhesion pressure.
