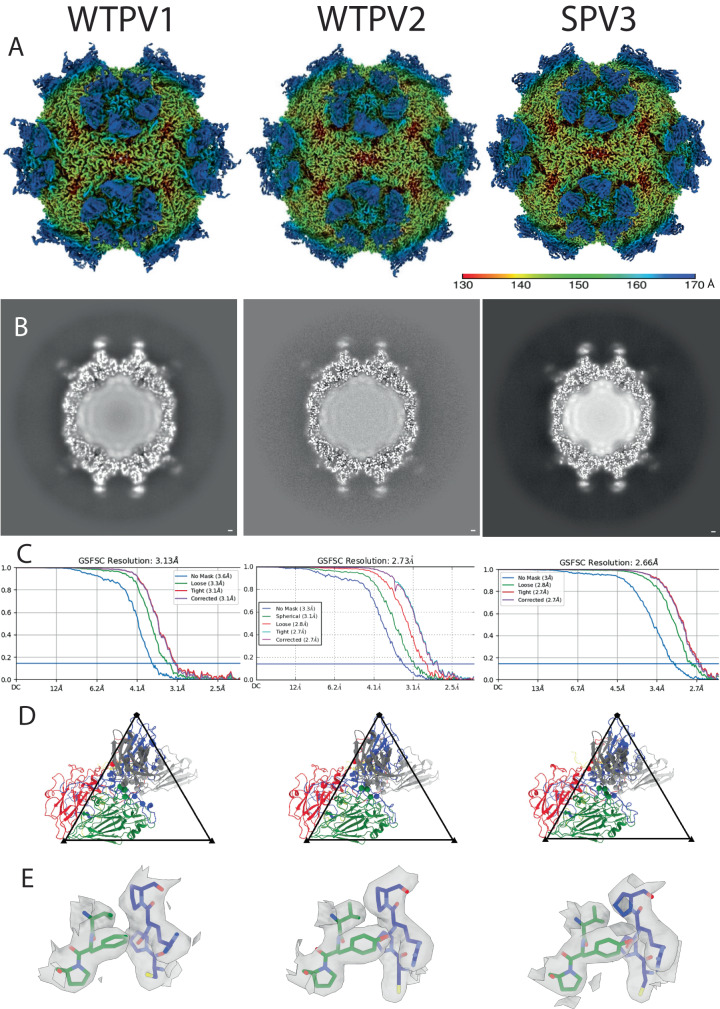
Fig. 1. 9H2 Fab binds virus with the same mode of binding in all three serotypes.
A Surface rendered DeepEMhancer sharpened maps are colored according to radius (color key) and show density corresponding to the 9H2 Fab. B The central section shows the Fab has a similar magnitude of density as the capsid. C FSC curves indicate resolution ranging from 2.7–3.1 Å at the gold standard 0.143 cutoff. D Refined models of single virus protomer (VP1–4; blue, green, red, yellow) and bound 9H2 variable domain (heavy and light chain; dark and light gray). Live virus 1, 2, and 3 data were taken at magnification x59,000, x59,000, and x120,000 resulting in pixel sizes of 1.1, 1.1, and 1.2, respectively. E For each complex, a representative area illustrating the quality of the model built into the map is shown. The map area highlighted includes residues VP1 270–273 and VP2 192–194. Coloration is VP1 (blue) and VP2 (green) with additional coloring by heteroatom.

