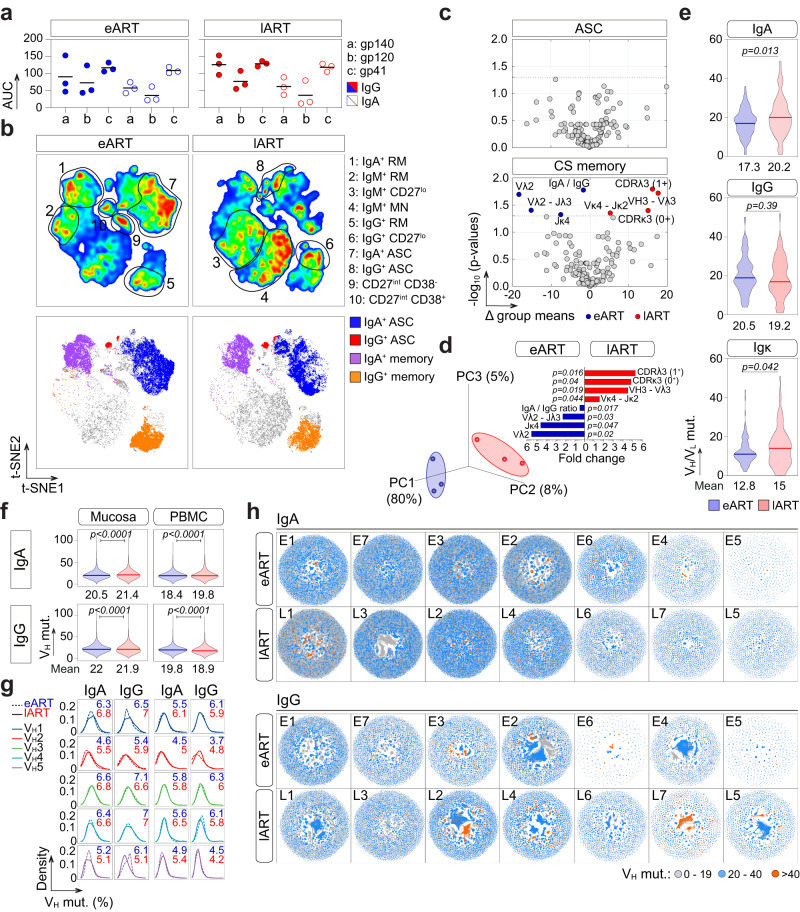
Fig. 1. Immunoglobulin gene repertoire of intestinal B cells from eART and lART.
a Dot plots comparing the serum anti-HIV-1 Env IgG (colored) and IgA (clear) antibody levels in eART (blue) and lART (red) individuals (n = 3 per group). The y axis indicates the area under the curve (AUC) values of the ELISA binding curves shown in Supplementary Fig. 1a. Bars correspond to the means. Samples were tested in two independent experiments. b t-SNE-based analysis comparing the subset distribution of single mucosal CD19+ cells between eART and lART donors (n = 3; 2 × 10⁵ cells per group) (top). Single-cell sorted B-cell sub-populations are shown in t-SNE plots (bottom). c Volcano plots comparing the immunoglobulin gene repertoires of intestinal antibody-secreting cells (ASC) and class-switched (CS) memory B cells (n = 206 parameters) between e-ART (blue) and l-ART (red). Dashed lines indicate the statistically significant cut-off (p < 0.05). d Plot showing the principal component analysis (PCA) of intestinal CS B cells in eART and lART (left). Contribution plot showing the fold changes of significantly diverging parameters between groups (right). Groups in (c) and (d) were compared using 2 × 2 Fisher’s Exact test. e Violin plots comparing the number of somatic mutations in the IgA/IgG VH (n = 143 for eART and n = 138 for lART) and Vκ genes (n = 96 for eART and n = 88 for lART) from single-sorted intestinal CS B cells between eART (n = 3) and lART donors (n = 3). f Violin plots comparing the number of somatic mutations in the IgA (n = 12,265,476 and 12,779,331 sequences for eART and lART, respectively) and IgG VH (n = 4,669,125 and 7,300,158 sequences for eART and lART, respectively) genes from mucosal and peripheral blood B cells analyzed by NGS between eART (n = 7) and lART (n = 7). The average number of mutations is indicated below each violin plot. Numbers of hypermutation in (e) and (f) were compared between groups using two-tailed unpaired Student’s t test with Welch’s correction. Bars in (e) and (f) represent the medians. g Divergence plots comparing the distribution of intestinal IgA+ and IgG+ B-cell sequences (y-axis) between eART (dashed line) and lART (straight line) according to their VH-gene family and hypermutation frequencies (x-axis). The average frequencies of mutations for eART (blue) and lART (red) are indicated in each plot. h Network visualization comparing the clonal expansion levels of intestinal of IgA+ and IgG+ B cells according to the somatic mutation loads between eART and lART HIV-1-infected individuals. Source data are provided as a Source Data file.

