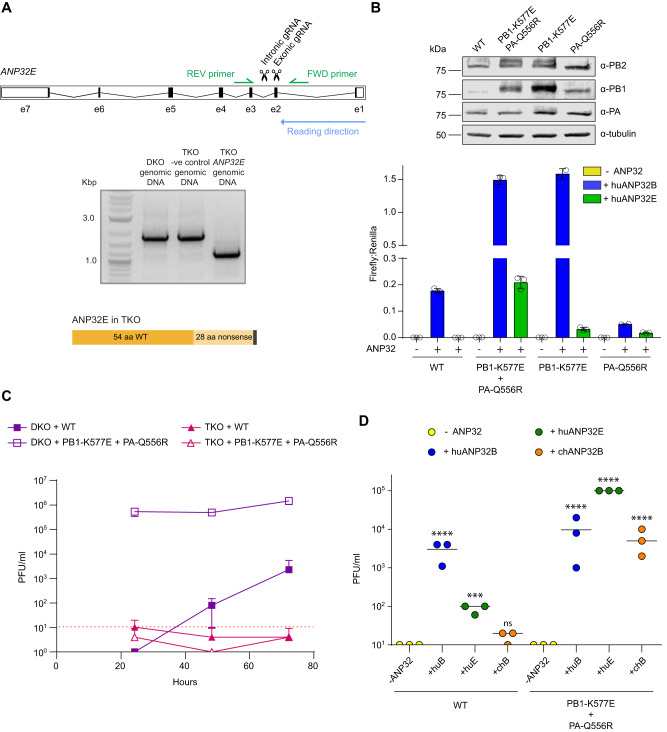
Fig. 3. PB1 K577E and PA Q556R allow appropriation of human ANP32E.
A Schematic showing the location of the CRISPR guide RNAs and PCR primers in huANP32E. Gel showing PCR product from genomic DNA for WT, −ve control and TKO cells and a schematic illustrating the resulting truncated ANP32E in TKO cells. A single TKO clone was obtained. B Minigenome assay conducted in 24-well plates of eHAP TKO cells transfected with pCAGGS Tky05 PB1 or K577E (0.04 µg), PB2 (0.04 µg), PA or Q556R (0.02 µg), NP (0.08 µg), reporter pPolI-luc (0.08 µg) and control pCAGGS-Renilla luciferase (0.04 µg) and +/− huANP32B-FLAG (0.04 µg). Data presented is representative of n = 3 biological repeats each conducted with n = 3 wells, presented as mean values +/− SD. Western blot showing expression of PB2, PB1, PA and tubulin. C Viral Growth curve in DKO and TKO cells for WT and PB1 K577E + PA Q556R virus. Six-well plates were infected with virus at MOI of 0.01 and samples plaqued at 24, 48 and 72 h, n = 3 wells presented as mean values +/− SD, limit of detection = 10 PFU/ml. D TKO cells were transfected in a 12-well plate with -ANP32, huANP32B, huANP32E or chANP32B (0.32 µg). After 24 h, cells were infected with either WT (Tky05) or PB1 K577E + PA Q556R virus at MOI of 1. Virus was titred at 72 h, n = 3 wells. Statistical significance was determined by one-way ANOVA of log transformed data. Samples were compared to -ANP32 of the appropriate virus, *P < 0.05, **P < 0.01, ***P < 0.001, ****P < 0.0001 3D; Tky WT -ANP32 vs Tky WT +huANP32B p < 0.0001, Tky WT -ANP32 vs Tky WT +huANP32E p = 0.0005, Tky WT -ANP32 vs Tky WT +chANP32B p = 0.2189, Tky PB1-K577E + PA-Q556R -ANP32 vs Tky PB1-K577E + PA-Q556R +huANP32B p < 0.0001, Tky PB1-K577E + PA-Q556R -ANP32 vs Tky PB1-K577E + PA-Q556R +huANP32E p < 0.0001, Tky PB1-K577E + PA-Q556R -ANP32 vs Tky PB1-K577E + PA-Q556R +chANP32B p < 0.0001. Source data are provided as a Source Data file.

