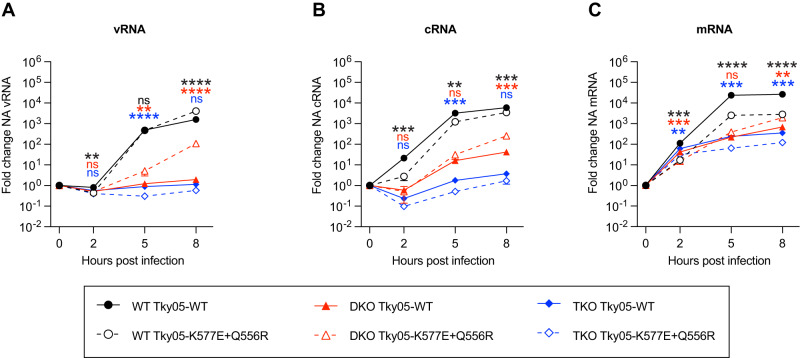
Fig. 6. PB1 K577E + PA Q556R requires ANP32E to support vRNA synthesis.
A–C Segment 6 vRNA (A) cRNA (B) or mRNA (C) accumulation over time in eHAP WT, DKO and TKO cells following infection with Tky05-WT or Tky05-K577E + Q556R (MOI = 3). Fold change was calculated over input (0 h.p.i.) for each cell type. n = 3 biological replicates, plotted as mean ± s.d. Statistical significance was assessed using multiple unpaired two-sided t tests following log transformation, corrected for multiple comparisons using the false discovery rate *P < 0.05, **p < 0.01; ***p < 0.001; ****p < 0.0001. Statistical comparisons are between Tky05-WT and Tky05-K577E + Q556R within the same cell line at each timepoint (vRNA WT cells; 2 h, p = 0.0043, 5 h p = 0.7484, 8 h p < 0.0001, vRNA DKO cells; 2 h P = 0.8564, 5 h p = 0.0043, 8 h p < 0.0001, vRNA TKO cells; 2 h p = 0.0464, 5 h p < 0.0001, 8 h p = 0.0266, cRNA WT cells; 2 h p = 0.009, 5 h p = 0.0015, 8 h p = 0.0004, cRNA DKO cells; 2 h p = 0.4967, 5 h p = 0.0539, 8 h p = 0.0102, cRNA TKO cells; 2 h p = 0.0444, 5 h p = 0.0004, 8 h p = 0.0102, mRNA WT cells; 2 hrs p = 0.0003, 5 h p < 0.0001, 8 h p < 0.0001, mRNA DKO cells; 2 h p = 0.0003, 5 h p = 0.0259, 8 h p = 0.0010, mRNA TKO cells; 2 h p = 0.0035, 5 h p = 0.0004, 8 h p = 0.0002). Comparisons for WT cells are shown at the top, DKO cells in the middle and TKO cells at the bottom (indicated by matching colour to traces). Source data are provided as a Source Data file.

