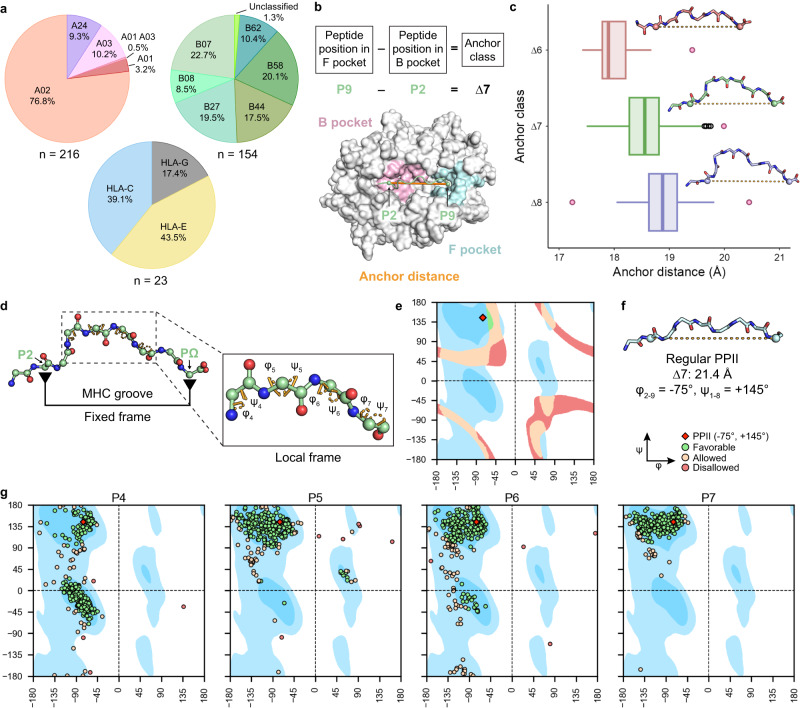
Fig. 1. Analysis of pHLA structures in HLA3DB uncovers the basis for peptide conformational diversity.
a Distribution of pHLA structures in HLA3DB by supertype for HLA-A and HLA-B and single-resolution allotype for HLA-C, HLA-E, and HLA-G. b Schematic depicting how anchor class and anchor distance are defined using the ∆7 anchor class as an example. Cα atoms of anchor residues are shown as green spheres and connected by an orange solid line depicting the anchor distance. B and F pockets are shaded in pink and blue, respectively, and the remainder of the HLA is colored in gray. c Distribution of anchor distances for each anchor class with the center indicating the median (∆6 pHLA structures: n = 15; ∆7 pHLA structures: n = 303; ∆8 pHLA structures: n = 75). Whiskers extend to the furthest values that lie within the 75th and 25th percentile value ± 1.5 times the interquartile range. Outliers are shown in black and pink circles with pink data points elaborated in Supplementary Fig. 1c–f. Peptide backbones corresponding to the median anchor distance of each anchor class are shown above each respective boxplot (∆6: PDB ID 1E28 [10.2210/pdb1E28/pdb], ∆7: PDB ID 1K5N [10.2210/pdb1K5N/pdb], ∆8: PDB ID 3I6K [10.2210/pdb3I6K/pdb]). d A schematic of the fixed-local framework for conformational diversity. On the right, the inset highlights the central bulge of the peptide and the respective dihedral angles in orange dashed sectors. Backbone heavy atoms are shown as spheres. e General Ramachandran plot showing dihedral angle pairs satisfying the anchor distance distribution seen in the ∆7 anchor class. Favorable overlaps are colored green, allowed overlaps are colored cream, and disallowed overlaps are colored red. Favorable regions are shaded blue, allowed regions are shaded light blue, and unfavorable regions are shaded white. PPII conformation is shown as a red diamond at (−75°, +145°). f Backbone of a de novo designed polyglycine nonamer with all dihedral angles set to the PPII angle (−75°, +145°). Cα atoms of anchor positions are shown as spheres and connected via an orange dotted line to indicate anchor distance. g General Ramachandran plots of all ∆7 peptides (n = 303). Plots are shaded identically to (b) with discrete points instead of shaded surfaces.

